我想知道在VS Code中是否可以像在PyCharm中显示Pandas数据框(第二张图片)一样显示数据框(第一张图片)?
感谢任何帮助。
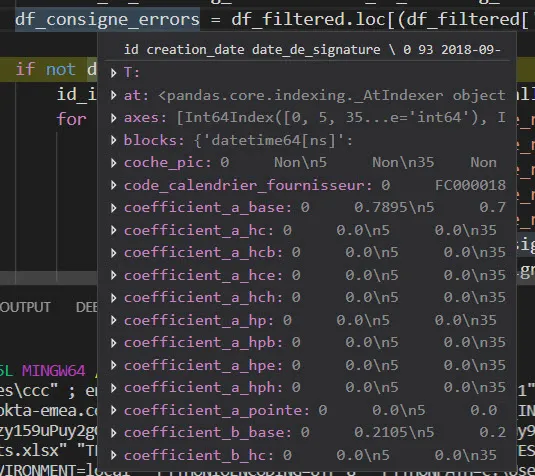
df 在 VS Code 中的输出:
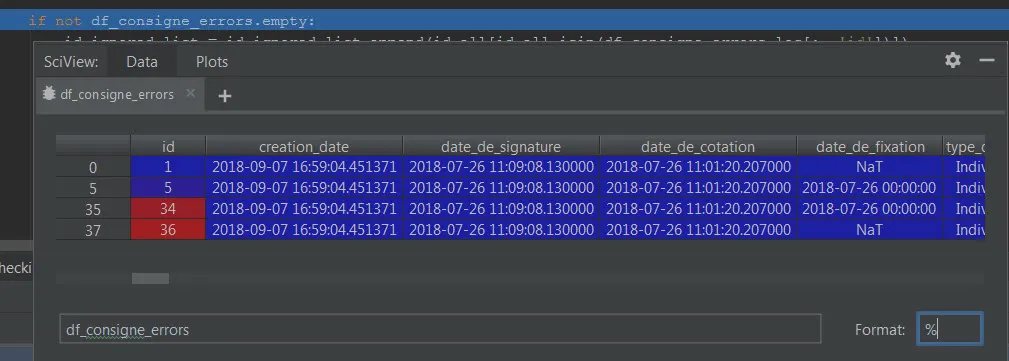
df 在 PyCharm 中的输出:
我想知道在VS Code中是否可以像在PyCharm中显示Pandas数据框(第二张图片)一样显示数据框(第一张图片)?
感谢任何帮助。
df 在 VS Code 中的输出:
df 在 PyCharm 中的输出:
截至2021年1月发布版的Python扩展中,现在可以在调试本地Python程序时使用内置数据查看器查看Pandas数据框。当程序在断点处停止时,在变量列表中右键单击数据框变量,然后选择“在数据查看器中查看值”。
Tabulate是一个优秀的库,可以实现pandas df的漂亮打印:
信息 - 链接:[https://pypi.org/project/tabulate/]
请按照以下步骤完成漂亮的打印: (注意:为了简单说明,我将在Python中创建简单的数据帧)
1)安装tabulate
pip install --upgrade tabulate
这条语句将始终安装 tabulate 库的最新版本。
2)导入语句
import pandas as pd
from tabulate import tabulate
3) 创建简单的临时数据框
temp_data = {'Name': ['Sean', 'Ana', 'KK', 'Kelly', 'Amanda'],
        'Age': [42, 52, 36, 24, 73],
        'Maths_Score': [67, 43, 65, 78, 97],
        'English_Score': [78, 98, 45, 67, 64]}
df = pd.DataFrame(temp_data, columns = ['Name', 'Age', 'Maths_Score', 'English_Score'])
4) 没有对数据框进行制表,我们的打印输出将是:
print(df)

    Name  Age  Maths_Score  English_Score
0    Sean   42           67             78
1     Ana   52           43             98
2      KK   36           65             45
3   Kelly   24           78             67
4  Amanda   73           97             64
5) 使用tabulate之后,您的漂亮打印输出将是:
print(tabulate(df, headers='keys', tablefmt='psql'))

+----+--------+-------+---------------+-----------------+
|    | Name   |   Age |   Maths_Score |   English_Score |
|----+--------+-------+---------------+-----------------|
|  0 | Sean   |    42 |            67 |              78 |
|  1 | Ana    |    52 |            43 |              98 |
|  2 | KK     |    36 |            65 |              45 |
|  3 | Kelly  |    24 |            78 |              67 |
|  4 | Amanda |    73 |            97 |              64 |
+----+--------+-------+---------------+-----------------+
印刷效果清晰,感受爽脆!如果你喜欢我的回答,请留下评论!
df = pd.DataFrame(data={"animal_1": ["elk", "pig"], "animal_2": ["dog", "quetzal"]})
print(df.to_markdown())

|    | animal_1   | animal_2   |
|---:|:-----------|:-----------|
|  0 | elk        | dog        |
|  1 | pig        | quetzal    |
breakpoint() where you want to break if using attach mode.when debugging use the debug console to:
display(df_consigne_errors)