如果我执行以下命令:
for file in files:
    display(Image(filename=os.path.join(folder,file)))
我得到了一列图片列表:
如何将它们放在一行(水平排列)?
这个方法对我起作用了:
from matplotlib.pyplot import figure, imshow, axis
from matplotlib.image import imread

def showImagesHorizontally(list_of_files):
    fig = figure()
    number_of_files = len(list_of_files)
    for i in range(number_of_files):
        a=fig.add_subplot(1,number_of_files,i+1)
        image = imread(list_of_files[i])
        imshow(image,cmap='Greys_r')
        axis('off')

你也可以使用HTML:
from IPython.display import display, HTML
def make_html(folder, image):
     return '<img src="{}" style="display:inline;margin:1px"/>'
            .format(os.path.join(folder, image))

display(HTML(''.join(make_html(f, x)) for x in files))
在我的情况下,通过设置边距将修复不对齐的问题(并且我个人认为会产生更好的结果)。
from IPython.display import display
from ipywidgets import widgets, HBox

imageA = widgets.Image(value=open('path/to/image/a.jpg', 'rb').read())
imageB = widgets.Image(value=open('path/to/image/b.jpg', 'rb').read())

hbox = HBox([imageA, imageB])
display(hbox)

# optional: you can show more hboxes, boxes will be arranged vertically
display(anotherHbox) # 2nd
display(yetAnotherHbox) # 3rd
display(andAnotherHbox) # 4th
参考文献:
widgets.Image的使用:https://ipywidgets.readthedocs.io/en/latest/examples/Widget%20List.html#ImageHBox和布局:https://ipywidgets.readthedocs.io/en/latest/examples/Widget%20Styling.htmldisplay模块:https://ipython.readthedocs.io/en/stable/api/generated/IPython.display.html#IPython.display.display请注意,IPython display模块也有Image类,它与widgets.Image不同,且与HBox不兼容。
我认为你需要创建一个具有子图的图形,并将每个图形分配给一个子图。就像这样:
import matplotlib.pyplot as plt
f,ax = plt.subplots(1,5)
for i in range(5):
    ax[i].imshow(yourimage)
plt.show() # or display.display(plt.gcf()) if you prefer
import matplotlib.pyplot as plt

def grid_display(list_of_images, list_of_titles=[], no_of_columns=2, figsize=(10,10)):

    fig = plt.figure(figsize=figsize)
    column = 0
    for i in range(len(list_of_images)):
        column += 1
        #  check for end of column and create a new figure
        if column == no_of_columns+1:
            fig = plt.figure(figsize=figsize)
            column = 1
        fig.add_subplot(1, no_of_columns, column)
        plt.imshow(list_of_images[i])
        plt.axis('off')
        if len(list_of_titles) >= len(list_of_images):
            plt.title(list_of_titles[i])
参数:
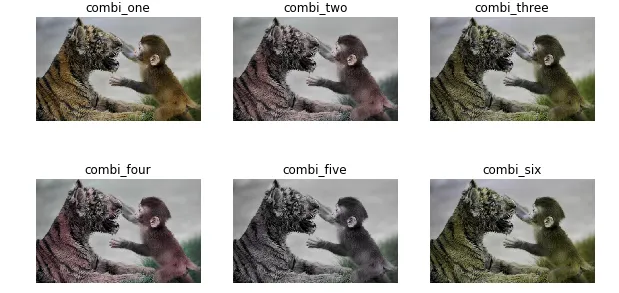
list_of_images - 包含您想显示的所有图像的列表。list_of_titles - 包含所有图像标题的列表,顺序与图像相同。no_of_columns - 网格中的列数。figsize - 每行的大小,以防止挤压。 (水平尺寸,垂直尺寸)。示例:
import cv2
import matplotlib.pyplot as plt

img = cv2.imread("files/tiger_monkey.jpg")
grey_img = cv2.imread("files/tiger_monkey_grey.png")

img_b, img_g, img_r = cv2.split(img)
grey_img_b, grey_img_g, grey_img_r = cv2.split(grey_img)

combi_one = cv2.merge((img_b, grey_img_g, img_r))
combi_two = cv2.merge((grey_img_b, grey_img_g, img_r))
combi_three = cv2.merge((img_b, img_g, grey_img_r))
combi_four = cv2.merge((grey_img_b, img_g, img_r))
combi_five = cv2.merge((grey_img_b, img_g, grey_img_r))
combi_six = cv2.merge((img_b, grey_img_g, grey_img_r))

titles = ["combi_one",
          "combi_two",
          "combi_three",
          "combi_four",
          "combi_five",
          "combi_six"]
images = [combi_one,
          combi_two,
          combi_three,
          combi_four,
          combi_five,
          combi_six]

images = [cv2.cvtColor(image, cv2.COLOR_BGR2RGB) for image in images]
grid_display(images, titles, 3, (10,10))
原始图片:
display: grid; grid-columns: 1fr 1fr;,但某些元素(如plotly生成的SVG)被裁剪而不是缩小。 - Tronic