定位轴标签

32

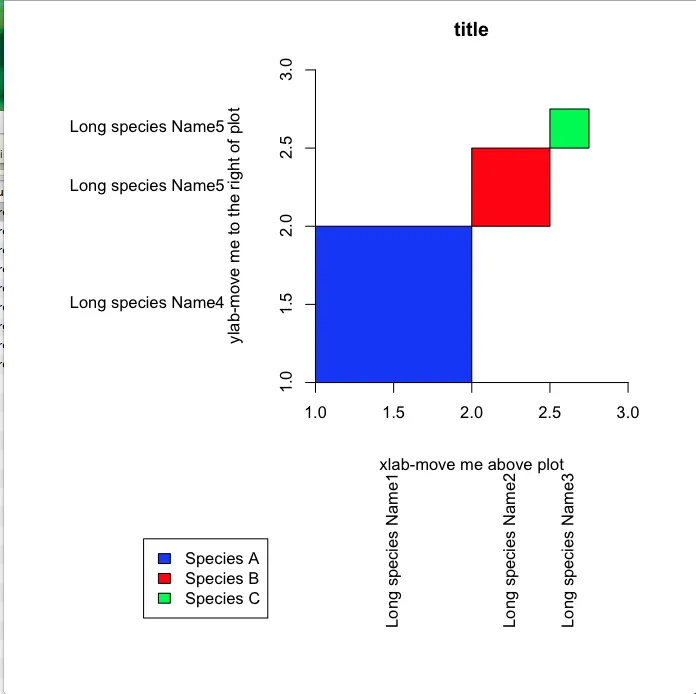
如何将以下图表中的y轴标签从左侧移到右侧,将x轴标签从下方移到上方?谢谢。

xleft<-c(1,2,2.5)
xright<-c(2,2.5,2.75)
ybottom<-c(1,2,2.5)
ytop<-c(2,2.5,2.75)

par(mar = c(15,15,2.75,2.75) + 0.1)
plot(c(1,3),c(1,3),type="n",main="title",xlab="xlab-move me above plot",ylab="ylab-move me      right of plot",axes=F,asp=1)
axis(1,pos=1)
axis(2,pos=1)


rect(xleft,ybottom,xright,ytop,col=c("blue","red","green"))

#Label position along  axes
x.label.position<-(xleft+xright)/2
y.label.position<-(ybottom+ytop)/2

#Labels
x.label<-c("Long species Name1","Long species Name2","Long species Name3")
y.label<-c("Long species Name4","Long species Name5","Long species Name5")

text(par()$usr[1]-0.5,y.label.position,y.label,xpd=TRUE,adj=1)
text(y=par()$usr[3]-0.5,x=x.label.position,x.label,xpd=TRUE,adj=1,srt=90)

par(xpd=TRUE)
legend(-0.1,0,legend=c("Species A","Species B","Species C"),fill=c("blue", "red", "green"))

这里输入图片描述


顺便说一下,这个问题正是我在你之前的问题中发表评论的原因。 - plannapus
我仍然不明白你的意思,plannapus。改变轴而不改变绘图区域如何影响x和y标签呢? - Elizabeth
你只是移动了坐标轴,而不是图形的限制:你的标签距离图形的限制而不是坐标轴有一定的距离(在 axis 调用后输入 box(),使图形的限制出现,你就会明白我的意思)。这并不是一个大问题,因为 Backlin 的解决方案仍然可以工作。 - plannapus
啊,我明白你的意思了。谢谢你的教训 :) - Elizabeth
1个回答

66

在绘图中添加右侧和顶部的坐标轴

R默认情况下会将x轴绘制在绘图区域下方,将y轴绘制在其左侧。您可以按照以下方式更改此行为:

plot(1:100, cumsum(rnorm(100)), type="l", axes=FALSE) # Do not plot any axes
axis(3)   # Draw the x-axis above the plot area
axis(4)   # Draw the y-axis to the right of the plot area
box()

enter image description here

为了移动标签,您可以设置ann=FALSExlab=""ylab="",然后使用mtext添加标签。其中,side=1表示底部,side=2表示左侧,side=3表示顶部,side=4表示右侧。通过调整line控制与绘图区的距离。
plot(1:100, cumsum(rnorm(100)), type="l", axes=FALSE, ann=FALSE)
axis(3)
box()
mtext("Top axis", side=3, line=3)

enter image description here

更改标签、刻度和绘图区之间的距离

使用mgp参数来控制这些细节,可以在调用plot之前进行设置,如下所示:

par(mgp=c(axis.title.position, axis.label.position, axis.line.position))

或者在plot命令本身中,像这样

plot(1:100, cumsum(rnorm(100)), type="l", mgp=c(2,1,.5), las=1)

enter image description here

此外,请注意 las 参数,它将所有刻度标签转为水平,使其更易于阅读。

谢谢!那个很好用,尽管我不得不使用line=-1来改变它的位置。类似地,是否有可能以类似的方式“翻转”轴刻度和相关编号?如果您认为这是一个不同的问题,我可以发布一个新问题。再次感谢。 - Elizabeth
4
las参数控制刻度标签、mtext和其他文本相关事物的旋转。使用plot(..., las=1)将所有刻度标签横向排列。这确实是一个非常好的想法,它让图表更易于阅读。 - Backlin
嗯...抱歉,我觉得我的问题可能不太清楚。我想把刻度线和数字移到绘图区域的上方和右侧。las命令只是用于相对于轴旋转文本..我想把轴移到绘图的另一侧。 - Elizabeth
哦,那我一点都不清楚。我从未见过像那样的R绘图。 - Backlin

网页内容由stack overflow 提供, 点击上面的
可以查看英文原文,
原文链接