在Highcharts中的堆叠柱形图中,如何实现重叠和圆角堆叠?

4
我正在尝试实现类似2014年所示的列,但我还没有找到提供此类分层的方法。这是我目前拥有的演示
2 columns having different stacks

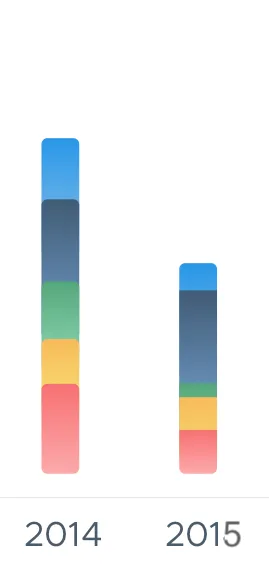
我需要制作一个堆叠柱状图,看起来像2014年或2015年的列(可行的那个)。
  • 2014年列的问题在于,我找不到任何属性来给出(负)边距以实现上述结果。

  • 2015年列的问题在于,我无法仅向左上角和右上角添加边框半径。

由于fiddle链接必须附带代码

Highcharts.chart('container', {
  chart: {
    type: 'column',
    spacingBottom: 0
  },
  title: {
    text: ''
  },
  xAxis: {
    categories: ['Apples', 'Oranges', 'Pears', 'Grapes', 'Bananas'],
    offset: 7,
    lineWidth: 0,
    tickLength: 0
  },
  yAxis: {
    min: 0,
    title: {
      text: ''
    },
    stackLabels: {
      enabled: false,
      style: {
        fontWeight: 'bold',
        color: 'gray'
      }
    },
    visible: false
  },
  legend: {
    align: 'center',

    verticalAlign: 'bottom',

  },
  tooltip: {
    headerFormat: '<b>{point.x}</b><br/>',
    pointFormat: '{series.name}: {point.y}<br/>Total: {point.stackTotal}'
  },
  plotOptions: {
    series: {

    },
    column: {
      stacking: 'normal',
      borderWidth: 0,
      borderRadius: 5,
      dataLabels: {
        enabled: true,
        color: 'white'
      }
    }
  },
  series: [{
    name: 'John',
    data: [5, 3, 4, 7, 2],

  }, {
    name: 'Jane',
    data: [2, 2, 3, 2, 1]
  }, {
    name: 'Joe',
    data: [3, 4, 4, 2, 5]
  }]
});
<script src="https://code.highcharts.com/highcharts.js"></script>
<script src="https://code.highcharts.com/modules/exporting.js"></script>
<script src="https://code.highcharts.com/modules/export-data.js"></script>

<div id="container" style="min-width: 310px; height: 400px; margin: 0 auto"></div>

2个回答

2
为了实现你的 2014 年目标,你可以使用一个 Highcharts 封装,并更改绘制点的方式,如下所示:highchart wrapper
(function (H) {
  H.wrap(H.seriesTypes.column.prototype, 'drawPoints', function (proceed) {
    $.each(this.points, function (i,point) {
      let borderRadius = this.options.borderRadius;
      point.shapeArgs.y -=  borderRadius; //move the point down by borderRadius pixels
      point.shapeArgs.height +=  borderRadius; //add borderRadius pixels to the total height of a point (to cover the gap)
    });
    proceed.apply(this, Array.prototype.slice.call(arguments, 1));
  });
}(Highcharts));

    (function (H) {
      H.wrap(H.seriesTypes.column.prototype, 'drawPoints', function (proceed) {
        let seriesIndex = this.index
        $.each(this.points, function (i,point) {
         point.shapeArgs.y -= seriesIndex == 0 ? 0 : 5; //if it is not the first series, then move the series down 5 pixels
            point.shapeArgs.height +=  5; //add 5 pixels to the total height(to cover the gap)
          });
          proceed.apply(this, Array.prototype.slice.call(arguments, 1));
        });
    }(Highcharts));

Highcharts.chart('container', {
  chart: {
    type: 'column',
    spacingBottom: 0
  },
  title: {
    text: ''
  },
  xAxis: {
    categories: ['Apples', 'Oranges', 'Pears', 'Grapes', 'Bananas'],
    offset: 7,
    lineWidth: 0,
    tickLength: 0
  },
  yAxis: {
    min: 0,
    title: {
      text: ''
    },
    stackLabels: {
      enabled: false,
      style: {
        fontWeight: 'bold',
        color: 'gray'
      }
    },
    visible: false
  },
  legend: {
    align: 'center',

    verticalAlign: 'bottom',

  },
  tooltip: {
    headerFormat: '<b>{point.x}</b><br/>',
    pointFormat: '{series.name}: {point.y}<br/>Total: {point.stackTotal}'
  },
  plotOptions: {
    series: {

    },
    column: {
      stacking: 'normal',
      borderWidth: 0,
      borderRadius: 5,
      dataLabels: {
        enabled: true,
        color: 'white'
      }
    }
  },
  series: [{
    name: 'John',
    data: [5, 3, 4, 7, 2],

  }, {
    name: 'Jane',
    data: [2, 2, 3, 2, 1]
  }, {
    name: 'Joe',
    data: [3, 4, 4, 2, 5]
  }]
});
<script src="https://ajax.googleapis.com/ajax/libs/jquery/2.1.1/jquery.min.js"></script>
<script src="https://code.highcharts.com/highcharts.js"></script>
<script src="https://code.highcharts.com/modules/exporting.js"></script>
<script src="https://code.highcharts.com/modules/export-data.js"></script>

<div id="container" style="min-width: 310px; height: 400px; margin: 0 auto"></div>

可工作的JSFiddle:https://jsfiddle.net/ewolden/cyfv64ub/122/

如果你想要得到2015的结果,你可以使用同样的函数,如下所示:

(function(H) {
  H.wrap(H.seriesTypes.column.prototype, 'drawPoints', function(proceed) {
    let seriesIndex = this.index,
      firstIndex = this.chart.series[0].index,
      lastIndex = this.chart.series[this.chart.series.length - 1].index,
      borderRadius = this.options.borderRadius;

    this.options.borderRadius = 0; //Remove the border radius

    $.each(this.points, function(i, point) {
      if (seriesIndex != firstIndex && seriesIndex != lastIndex) {
        point.shapeArgs.y -= borderRadius; //make sure the middle points cover the outer points
        point.shapeArgs.height += borderRadius*2; 
      }
    });

    proceed.apply(this, Array.prototype.slice.call(arguments, 1));

    $.each(this.points, function(i, point) {
      if (seriesIndex == firstIndex || seriesIndex == lastIndex) {
        point.graphic.attr({
          r: borderRadius //set the borer radius to be whatever it was before to only the outer points
        });
      }
    });
  });
}(Highcharts));

我手动设置了系列的zIndex,但这也可以通过其他方式实现。只是现在没有时间找到在哪里设置它。

(function(H) {
  H.wrap(H.seriesTypes.column.prototype, 'drawPoints', function(proceed) {
    let seriesIndex = this.index,
      firstIndex = this.chart.series[0].index,
      lastIndex = this.chart.series[this.chart.series.length - 1].index,
      borderRadius = this.options.borderRadius;

    this.options.borderRadius = 0; //Remove the border radius

    $.each(this.points, function(i, point) {
      if (seriesIndex != firstIndex && seriesIndex != lastIndex) {
        point.shapeArgs.y -= borderRadius; //make sure the middle points cover the outer points
        point.shapeArgs.height += borderRadius*2; 
      }
    });

    proceed.apply(this, Array.prototype.slice.call(arguments, 1));

    $.each(this.points, function(i, point) {
      if (seriesIndex == firstIndex || seriesIndex == lastIndex) {
        point.graphic.attr({
          r: borderRadius //set the borer radius to be whatever it was before to only the outer points
        });
      }
    });
  });
}(Highcharts));

Highcharts.chart('container', {
  chart: {
    type: 'column',
    spacingBottom: 0
  },
  title: {
    text: ''
  },
  xAxis: {
    categories: ['Apples', 'Oranges', 'Pears', 'Grapes', 'Bananas'],
    offset: 7,
    lineWidth: 0,
    tickLength: 0
  },
  yAxis: {
    min: 0,
    title: {
      text: ''
    },
    stackLabels: {
      enabled: false,
      style: {
        fontWeight: 'bold',
        color: 'gray'
      }
    },
    visible: false
  },
  legend: {
    align: 'center',

    verticalAlign: 'bottom',

  },
  tooltip: {
    headerFormat: '<b>{point.x}</b><br/>',
    pointFormat: '{series.name}: {point.y}<br/>Total: {point.stackTotal}'
  },
  plotOptions: {
    series: {

    },
    column: {
      stacking: 'normal',
      borderWidth: 0,
      borderRadius: 5,
      dataLabels: {
        enabled: true,
        color: 'white'
      }
    }
  },
  series: [{
    name: 'John',
    data: [5, 3, 4, 7, 2],
    zIndex: 0
  }, {
    name: 'Jane',
    data: [2, 2, 3, 2, 1],
    zIndex: 1
  }, {
    name: 'Joe',
    data: [3, 4, 4, 2, 5],
    zIndex: 0
  }]
});
<script src="https://ajax.googleapis.com/ajax/libs/jquery/2.1.1/jquery.min.js"></script>
<script src="https://code.highcharts.com/highcharts.js"></script>
<script src="https://code.highcharts.com/modules/exporting.js"></script>
<script src="https://code.highcharts.com/modules/export-data.js"></script>

<div id="container" style="min-width: 310px; height: 400px; margin: 0 auto"></div>

可工作的JSFiddle: https://jsfiddle.net/ewolden/kqrLs3m8/

请注意,我在这里操纵了函数drawPoints,正如文档所述,它只会在开始时运行一次。因此,如果您开始禁用/启用系列,则它们可能不会像您期望的那样显示。


谢谢。在fiddle上运行得很好,需要在设备上检查一下。只有几个问题 - 1. 如果一个值太大而另一个数据太小(比如,我传递数据:[1,30,4,7,2]),这不会隐藏较小数据的图形吗? - mukesh.kumar
问题2 - “确保它不是系列中的第一个或最后一个点” - 我该如何做到这一点?我从未使用过包装函数,那么在较旧版本的highcharts(例如v4.2)上是否可行? - mukesh.kumar
1
它有可能会删除非常小的数据。当然,您可以添加检查,例如,如果 point.shapeArgs.y <= 5,则更改其行为。至于第二个问题,让我将其添加到 fiddle 中... 是的,引用:“自版本2.3以来,Highcharts是以模块化方式构建的,考虑到扩展性。” - ewolden
'point.shapeArgs.height += X' 这个 X 值应该和 borderRadius 相同吗? - mukesh.kumar
是的,没错。我更新了 fiddle 来回答问题2并反映 borderRadius 的更改。 - ewolden

0

谢谢@raf18seb提供的答案,但我已经尝试过这种方法了。问题在于,如果顶部或底部元素是0,则圆角将消失。 虽然我们可以应用逻辑,如如果最顶部的数据为0,则将圆角应用于第二个元素等等,但这将是一个非常肮脏的hack! - mukesh.kumar
1
谢谢你指出这个问题。你是正确的,这显然是不需要的行为。我会报告这个问题,我们将尝试在未来改进这个模块 ;) - raf18seb

网页内容由stack overflow 提供, 点击上面的
可以查看英文原文,
原文链接