使用matplotlib supxlabel时出现巨大的边距。

4

我正在尝试在matplotlib的子图中添加一个公共标签,但是遇到了一些问题。

我正在使用Python 3.10和Matplotlib 3.5.1
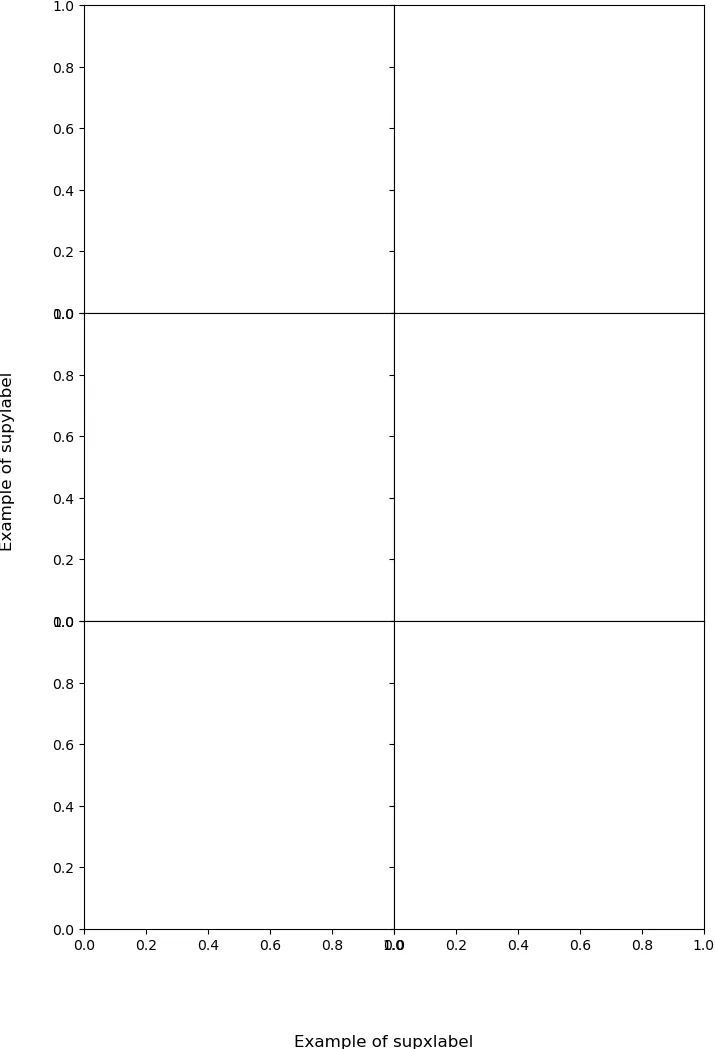
这里有一个最小工作示例来说明问题:

import matplotlib.pyplot as plt
fig, axs = plt.subplots(3, 2, figsize=(8, 12),  sharex=True, sharey=True)
fig.supxlabel('Example of supxlabel')
fig.supylabel('Example of supylabel')
fig.subplots_adjust(wspace=0, hspace=0)
plt.savefig('test.pdf', bbox_inches='tight', pad_inches=0)
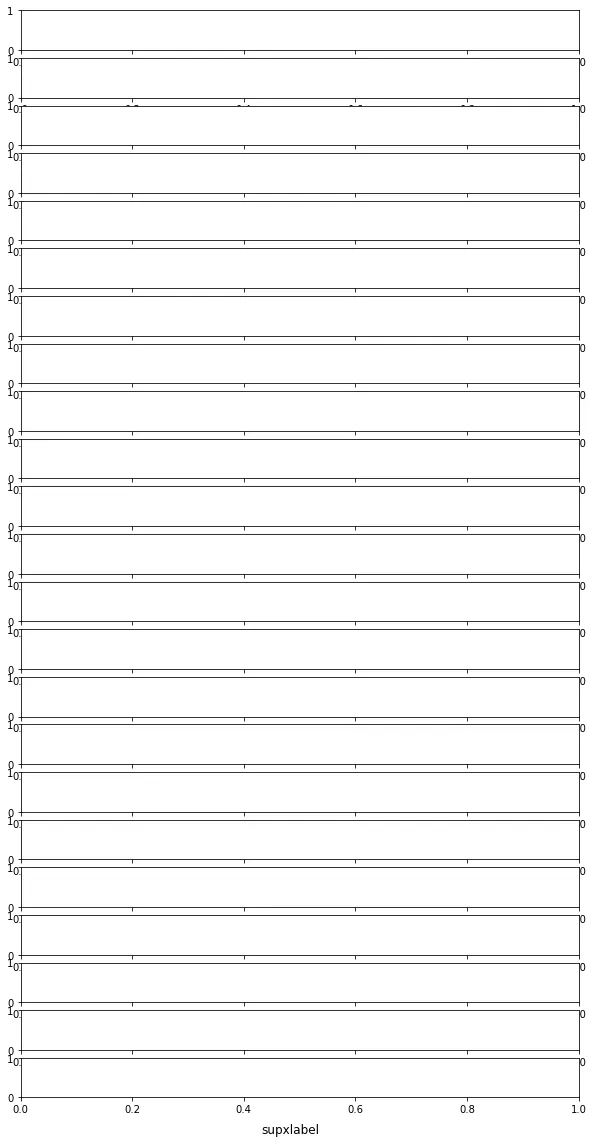
这段代码生成了以下图形:

this figure

请注意上方的巨大丑陋边距,位于“Example of supxlabel”和“Example of supylabel”的右侧。
我尝试使用选项constrained_layout=True,以及fig.set_constrained_layout_pads,但它没有解决我的问题。
我知道可以使用supxlabel和supylabel的x、y、va和ha选项来解决问题,但我有很多要生成的图形,无法实际手动查找和设置这些选项的值。

2
尝试使用plt.tight_layout(),您可以检查选项以自动变化不同的填充。 - Maxime Lavaud
1个回答

2
编辑:最简单的方法是使用plt.subplots(layout='constrained'),适用于各种操作;下面是如果需要完全控制的情况,'constrained'(据我所知)不允许。

我的当前解决方法是y = np.sqrt(height) / 100 * 2.2,至少对于height在5到25之间似乎效果不错。如果使用subplots_adjust(bottom=),一个恒定的调整因子似乎可以起作用,例如y -= .04。我已经打开了一个问题

width = 10
height = 20
y = np.sqrt(height) / 100 * 2.2
fig, _ = plt.subplots(23, 1, figsize=(width, height))
fig.supxlabel("supxlabel", y=y)

enter image description here


1
只需在 fig.supxlabel('label') 之前调用 fig.tight_layout() 即可,无需调整 yx - Basilique
2
从我尝试过的情况来看,我不认为这通常有效,但是layout='constrained'大多数情况下会起作用。 - OverLordGoldDragon

网页内容由stack overflow 提供, 点击上面的
可以查看英文原文,
原文链接