使用ggplot2约束小提琴图中分散的抖动点

6
以下是在ggplot2中生成小提琴图所使用的代码:

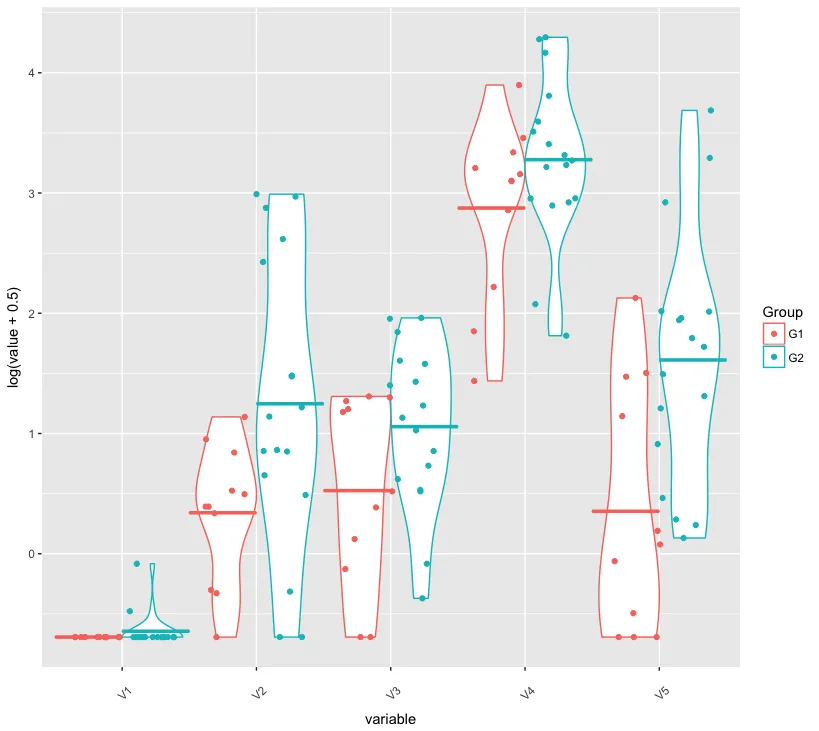
ggplot(violin,aes(x=variable,y=log(value+0.5),color=Group)) + 
  geom_violin(scale="width") + 
  geom_jitter(aes(group=Group), position=position_jitterdodge()) + 
  stat_summary(fun.y="mean",geom="crossbar", mapping=aes(ymin=..y.., ymax=..y..), 
     width=1, position=position_dodge(),show.legend = FALSE) + 
  theme(axis.text.x = element_text(angle = 45, margin=margin(0.5, unit="cm")))

一个生成的图形如下所示;

enter image description here

如您所见,有一些点被抖动到了小提琴形状的边界之外,我需要这些点在小提琴内部。我已经尝试了不同程度的抖动,但都没有成功。如果您有任何指导来实现这一点,我将不胜感激。

数据 violin 来自哪里? - dww
4
可以尝试使用ggforce::geom_sina - Richard Telford
3个回答

9

6

这是一个有点过时的问题,但我认为有更好的解决方案。

正如@Richard Telford在评论中指出的那样,geom_sina 是我认为最好的解决方案。

模拟数据

df <- data.frame(data=rnorm(1200), 
                 group=rep(c("A","A","A", "B","B","C"),
                           200)
                 )

制作图表
ggplot(df, aes(y=data,x=group,color=group)) +
  geom_violin()+
  geom_sina()

结果

输入图像描述

希望这对您有所帮助。


1
嗨@akh22,我很高兴它对你有用。如果你喜欢这个答案,你可能想要点赞和/或标记为你的问题的答案。谢谢 - Alfonso

5

Option 1

Using the function geom_quasirandom from package geom_beeswarm:

The quasirandom geom is a convenient means to offset points within categories to reduce overplotting. Uses the vipor package.

library(ggbeeswarm)
p <- ggplot(mpg, aes(class, hwy))
p + geom_violin(width = 1.3) + geom_quasirandom(alpha = 0.2, width = 0.2)

enter image description here

Option 2

Not a satisfactory answer, because by restricting the horizontal jitter we defeat the purpose of handling overplotting. But you can enlarge the width of the violin plots (width = 1.3), and play with alpha for transparency and limit the horizontal jitter (width = .02).

p <- ggplot(mpg, aes(class, hwy))
p + geom_violin(width = 1.3) + geom_jitter(alpha = 0.2, width = .02)

enter image description here


网页内容由stack overflow 提供, 点击上面的
可以查看英文原文,
原文链接