我找不到与我类似的问题,并且在阅读文档和其他问题时也没有找到解决问题的线索,因此我希望有人能在这里帮助我。
这是我的代码(从文档示例复制)
var margin = {top: 20, right: 20, bottom: 30, left: 150},
width = document.getElementById("aapp_content_charts").clientWidth - margin.left - margin.right,
height = 500 - margin.top - margin.bottom;

var x = d3.time.scale()
.range([0, width]);

var y = d3.scale.linear()
.range([height, 0]);

var xAxis = d3.svg.axis()
.scale(x)
.orient("bottom")
.ticks(3);

var yAxis = d3.svg.axis()
.scale(y)
.orient("left");

var line = d3.svg.line()
.x(function(d) { return x(d3.time.year(parseDate(d[0]))); })
.y(function(d) { return y(d[1]); });

var svg = d3.select("#aapp_content_charts").append("svg")
.attr("width", width + margin.left + margin.right)
.attr("height", height + margin.top + margin.bottom)
.append("g")
.attr("transform", "translate(" + margin.left + "," + margin.top + ")");


x.domain(d3.extent(list_indicators_3years_absolute['Gastos en activos financieros'] , function(d) { return parseDate(d[0]);}));
y.domain(d3.extent(list_indicators_3years_absolute['Gastos en activos financieros'] , function(d) { return d[1];}));

svg.append("g")
  .attr("class", "xaxis")
  .attr("transform", "translate(0," + height + ")")
  .call(xAxis);

svg.append("g")
  .attr("class", "yaxis")
  .call(yAxis)
    .append("text")
      .attr("transform", "rotate(-90)")
      .attr("y", 6)
      .attr("dy", ".71em")
      .style("text-anchor", "end")
      .text("(€)");

svg.append("path")
  .datum(list_indicators_3years_absolute['Gastos en activos financieros'])
  .attr("class", "line")
  .attr("d", line);
现在,您可能会想知道我的变量'list_indicators_3years_absolute ['Gastos en activos financieros']'的样子:
- 从console.log中:
[数组2, 数组2, 数组2] 0: 数组2 0: "2010" 1: 0 length: 2 proto: Array[0] 1: 数组2 0: "2011" 1: 29999996.8 length: 2 proto: Array[0] 2: 数组2 0: "2012" 1: 79204931.01 length: 2 proto: Array[0] length: 3 proto: Array[0]
- 一个更加直观的变量示例:
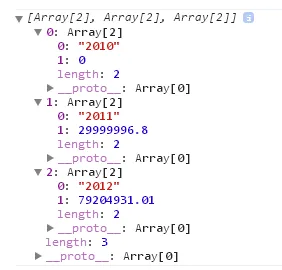
是的,只有三个点,分别代表三年(x轴):2010年、2011年、2012年。
下面是误差“线”图的样子:
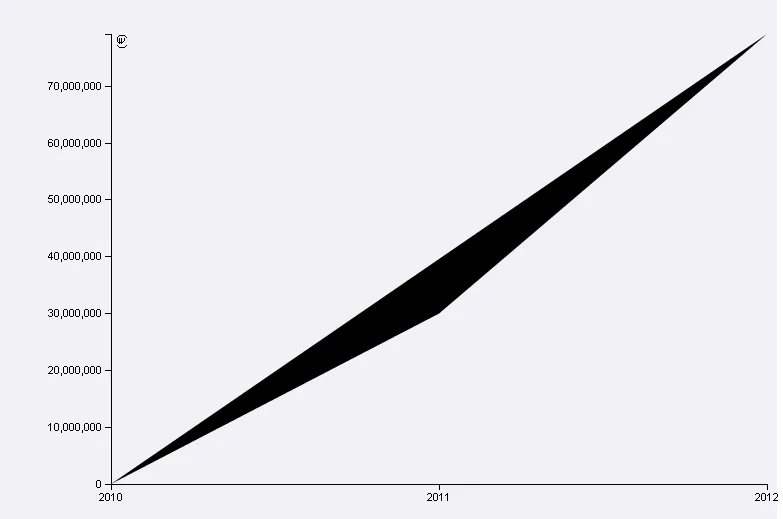
:-mmmmm
提前感谢!