D3.js 折线图网格问题

4

我使用d3.js创建了一个折线图,并在其中添加了x和y的网格线。但只有y轴的网格线显示出来,而x轴的网格线却没有。

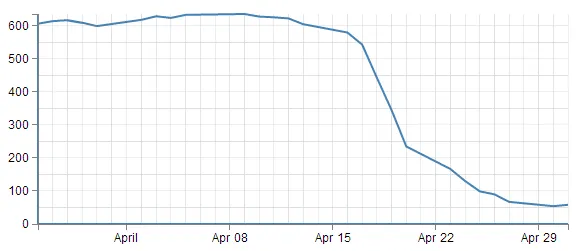
我希望能够创建如下所示的网格线,并在y轴的顶部添加一条线,使其看起来像完美的矩形。

enter image description here

var data = [{
  x: '1-May-12',
  y: 5
}, {
  x: '30-Apr-12',
  y: 28
}, {
  x: '27-Apr-12',
  y: 58
}, {
  x: '26-Apr-12',
  y: 88
}, {
  x: '25-Apr-12',
  y: 8
}, {
  x: '24-Apr-12',
  y: 48
}, {
  x: '23-Apr-12',
  y: 28
}, {
  x: '20-Apr-12',
  y: 68
}, {
  x: '19-Apr-12',
  y: 8
}, {
  x: '18-Apr-12',
  y: 58
}, {
  x: '17-Apr-12',
  y: 5
}, {
  x: '16-Apr-12',
  y: 80
}, {
  x: '13-Apr-12',
  y: 38
}];

var margin = {
    top: 30,
    right: 20,
    bottom: 35,
    left: 50
  },

  width = 1200 - (margin.left + margin.right);
height = 360 - 2 * (margin.top + margin.bottom);

// Parse the date / time
var parseDate = d3.time.format("%d-%b-%y").parse;
var xScale = d3.time.scale().range([0, width]);
var yScale = d3.scale.linear().range([height, 0]);

var xAxis = d3.svg.axis().scale(xScale)
  .orient("bottom").ticks(0).tickSize(0)
  .tickFormat("").outerTickSize(0);

var yAxis = d3.svg.axis().scale(yScale)
  .orient("left").tickSize(0).ticks(0)
  .tickFormat("");

var svg = d3.select("body")
  .append("svg")
  .attr("width", width + margin.left + margin.right)
  .attr("height", height + margin.top + margin.bottom)
  .attr("class", "bg-color")
  .append("g")
  .attr("transform", "translate(" + margin.left + "," + margin.top + ")");

function make_x_axis() {
  return d3.svg.axis()
    .scale(xScale)
    .orient("bottom")
    .ticks(5)
}

// function for the y grid lines
function make_y_axis() {
  return d3.svg.axis()
    .scale(yScale)
    .orient("left")
    .ticks(5);
}

svg.append("g")
  .attr("class", "grid")
  .call(make_x_axis()
    .tickSize(-height, 0, 0)
    .tickFormat("")
  );

// Draw the y Grid lines
svg.append("g")
  .attr("class", "grid")
  .call(make_y_axis()
    .tickSize(-width, 0, 0)
    .tickFormat("")
  );

xScale.domain(d3.extent(data, function(d) {
  return parseDate(d.x);
}));
yScale.domain([0, d3.max(data, function(d) {
  return d.y;
})]);


data.sort(function(a, b) {
  return parseDate(a.x) - parseDate(b.x);
});

// Add the X Axis
svg.append("g")
  .attr("class", "x axis")
  .attr("transform", "translate(0," + height + ")")
  .call(xAxis);

// Add the Y Axis
svg.append("g")
  .attr("class", "y axis")
  .call(yAxis);

// Define the line
var lineGen = d3.svg.line()
  .interpolate("monotone")
  .x(function(d) {
    return xScale(parseDate(d.x));
  })
  .y(function(d) {
    return yScale(d.y);
  });

svg.append('path')
  .attr("class", "line")
  .style("stroke", "red")
  .attr('d', lineGen(data));
.line {
  fill: none;
  stroke: steelblue;
  stroke-width: 1.5px;
}
.overlay {
  fill: none;
  pointer-events: all;
}
.focus circle {
  fill: none;
  stroke: steelblue;
}
.axis path,
.axis line {
  fill: none;
  stroke: grey;
  stroke-width: 2;
  shape-rendering: crispEdges;
}
.grid .tick {
  stroke: lightgrey;
  stroke-opacity: 0.7;
  shape-rendering: crispEdges;
}
.grid path {
  stroke-width: 0;
}
<script src="https://cdnjs.cloudflare.com/ajax/libs/d3/3.4.11/d3.min.js"></script>

1个回答

4

在jsfiddle上查看另一个示例。 https://jsfiddle.net/ermineia/cmqzh33x/

var data = [{
  x: '1-May-12',
  y: 5
}, {
  x: '30-Apr-12',
  y: 28
}, {
  x: '27-Apr-12',
  y: 58
}, {
  x: '26-Apr-12',
  y: 88
}, {
  x: '25-Apr-12',
  y: 8
}, {
  x: '24-Apr-12',
  y: 48
}, {
  x: '23-Apr-12',
  y: 28
}, {
  x: '20-Apr-12',
  y: 68
}, {
  x: '19-Apr-12',
  y: 8
}, {
  x: '18-Apr-12',
  y: 58
}, {
  x: '17-Apr-12',
  y: 5
}, {
  x: '16-Apr-12',
  y: 80
}, {
  x: '13-Apr-12',
  y: 38
}];

var margin = {
    top: 30,
    right: 20,
    bottom: 35,
    left: 50
  },

  width = 1200 - (margin.left + margin.right);
height = 360 - 2 * (margin.top + margin.bottom);

// Parse the date / time
var parseDate = d3.time.format("%d-%b-%y");
var xScale = d3.time.scale().range([0, width]);
var yScale = d3.scale.linear().range([height, 0]);
xScale.domain(d3.extent(data, function(d) {
  return parseDate.parse(d.x);
}));
yScale.domain([0, d3.max(data, function(d) {
  return d.y;
})]);


var xAxis = d3.svg.axis().scale(xScale)
  .orient("bottom").ticks(0).tickSize(0)
  .tickFormat("").outerTickSize(0);

var yAxis = d3.svg.axis().scale(yScale)
  .orient("left").tickSize(0).ticks(0)
  .tickFormat("");

var svg = d3.select("body")
  .append("svg")
  .attr("width", width + margin.left + margin.right)
  .attr("height", height + margin.top + margin.bottom)
  .attr("class", "bg-color")
  .append("g")
  .attr("transform", "translate(" + margin.left + "," + margin.top + ")");

function make_x_axis() {
  return d3.svg.axis()
    .scale(xScale)
    .orient("bottom")
    .ticks(25)
}

// function for the y grid lines
function make_y_axis() {
  return d3.svg.axis()
    .scale(yScale)
    .orient("left")
    .ticks(25);
}

svg.append("g")
  .attr("class", "grid")
  .call(make_x_axis()
    .tickSize(height, 0, 0)
    .tickFormat("")
  );

// Draw the y Grid lines
svg.append("g")
  .attr("class", "grid")
  .call(make_y_axis()
    .tickSize(-width, 0, 0)
    .tickFormat("")
  );


data.sort(function(a, b) {
  return parseDate.parse(a.x) - parseDate.parse(b.x);
});

// Add the X Axis
svg.append("g")
  .attr("class", "x axis")
  .attr("transform", "translate(0," + height + ")")
  .call(xAxis);

// Add the Y Axis
svg.append("g")
  .attr("class", "y axis")
  .call(yAxis);

// Define the line
var lineGen = d3.svg.line()
  .interpolate("monotone")
  .x(function(d) {
    return xScale(parseDate.parse(d.x));
  })
  .y(function(d) {
    return yScale(d.y);
  });

svg.append('path')
  .attr("class", "line")
  .style("stroke", "red")
  .attr('d', lineGen(data));
.line {
  fill: none;
  stroke: steelblue;
  stroke-width: 1.5px;
}
.overlay {
  fill: none;
  pointer-events: all;
}
.focus circle {
  fill: none;
  stroke: steelblue;
}
.axis path,
.axis line {
  fill: none;
  stroke: grey;
  stroke-width: 2;
  shape-rendering: crispEdges;
}
.grid .tick {
  stroke: lightgrey;
  stroke-opacity: 0.7;
  shape-rendering: crispEdges;
}
.grid path {
  stroke-width: 0;
}
<script src="https://cdnjs.cloudflare.com/ajax/libs/d3/3.4.11/d3.min.js"></script>


高度不对。应该是.tickSize(height, 0, 0)。在调试过程中,我将比例尺定义向上移动,并更改了日期函数的解析方式以更好地跟踪它。 - George Houpis
@nikunj2512 在我编辑的示例中,将ticks(5)更改为较大的ticks(25)。 - George Houpis
@GeorgeHoupis 将刻度(5)更改为刻度(25)只会增加刻度的数量,但如何使刻度之间的线条像上面的图片中所绘制的那样呢?例如,在Y轴上,刻度从0开始,0后面的下一个刻度是100,但在0和100之间还有一个没有刻度值的刻度。如何获得这种行为?此外,增加刻度的数量也不会删除您答案中可见的额外扩展刻度。如何删除这些额外的线条? - nikunj2512
如果您观察坐标轴的右下角,您会发现从轴开始时没有任何刻度线穿过负x和y轴。它们在(0,0)处完美地相遇。我希望在图形的顶部也有同样的效果,即x和y轴的刻度线相交。或者只需想象一个矩形框,我们在框内画了垂直和水平线,但这些线并没有穿过矩形边界。我希望两个轴和刻度线都可以像这样绘制。 - nikunj2512
@GeorgeHoupis 謝謝您提供的解決方案。 - nikunj2512
显示剩余3条评论

网页内容由stack overflow 提供, 点击上面的
可以查看英文原文,
原文链接