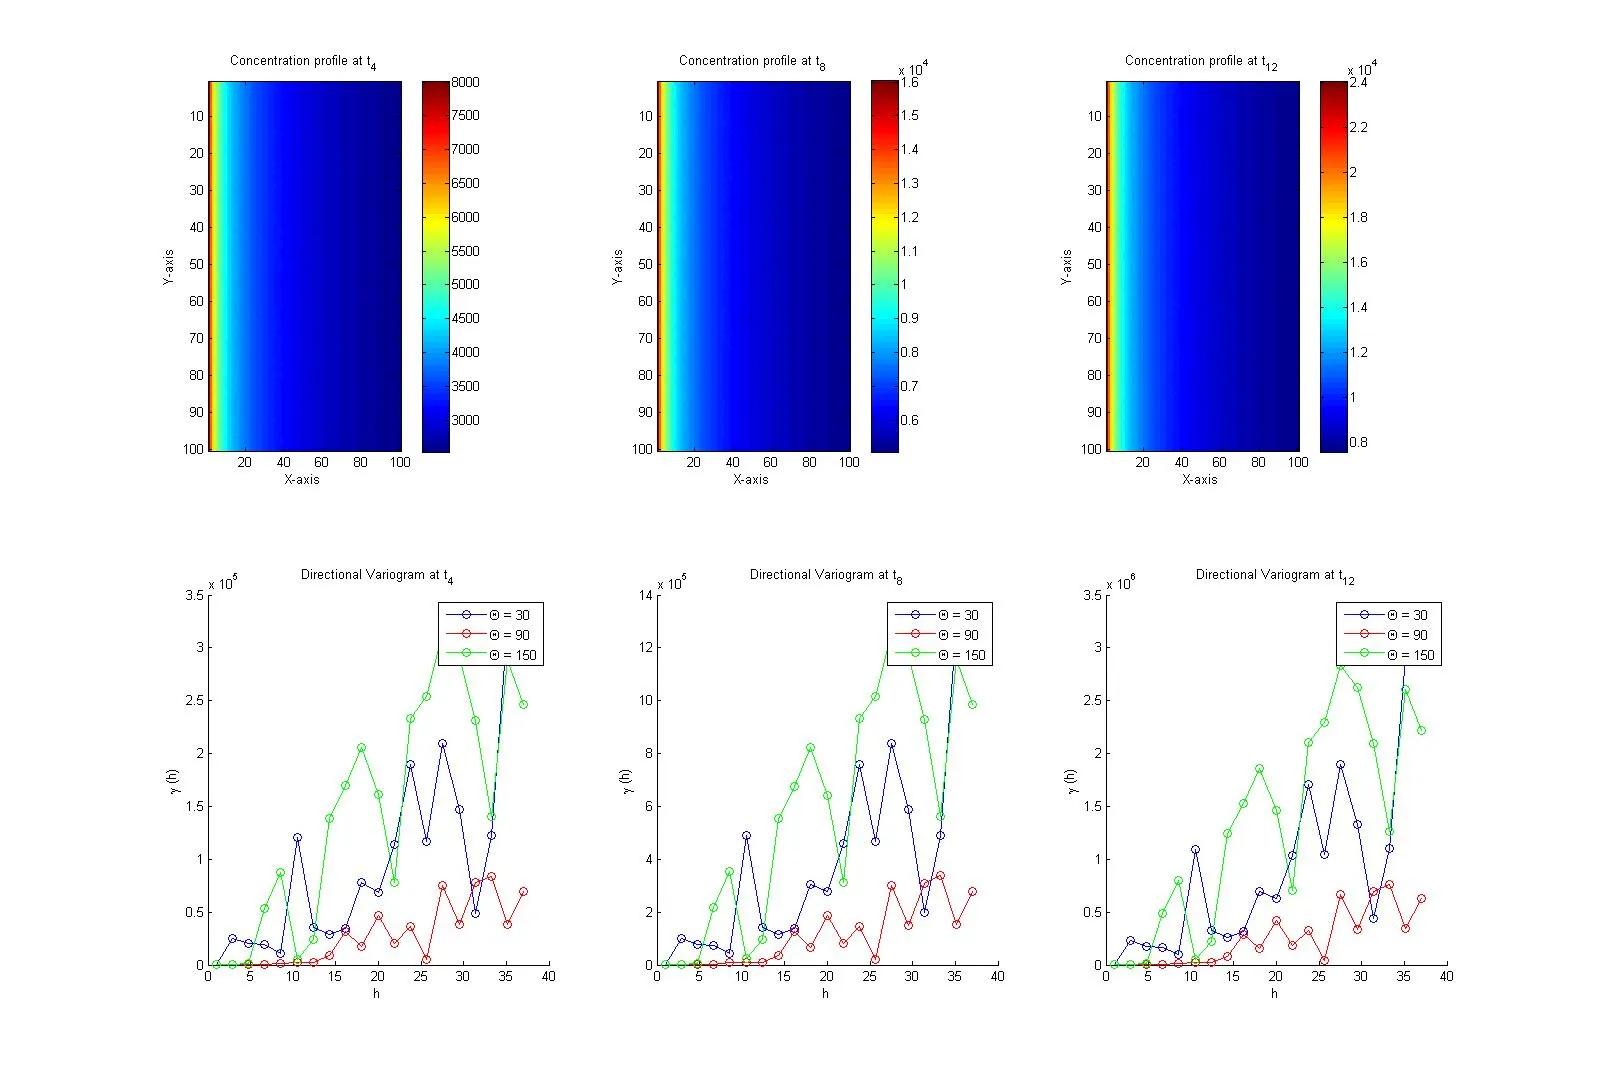
Matlab中的imagesc()函数不显示相等的坐标轴

3
我使用以下代码来绘制图像:
for t=1:subplotCol
    subplot(subplotRow,subplotCol,t)
    imagesc([1 100],[1 100],c(:,:,nStep*t));
    colorbar
    xlabel('X-axis')
    ylabel('Y-axis')
    title(['Concentration profile at t_{',num2str(nStep*t),'}'])

    subplot(subplotRow,subplotCol,subplotCol+t)
    hold on;
    plot(distance,gamma(:,1,t),'-ob');
    plot(distance,gamma(:,2,t),'-or');
    plot(distance,gamma(:,3,t),'-og');
    xlabel('h');ylabel('\gamma (h)');
    legend(['\Theta = ',num2str(theta(1))],...
        ['\Theta = ',num2str(theta(2))],['\Theta = ',num2str(theta(3))]);
end

我得到了以下带图像的子图:

enter image description here

如你所见,第一行中的图片现在在X和Y轴上等比缩放(Y轴比X轴长),即使第一行中每张图片的矩阵大小都是100x100。
有人能帮助我如何使第一行中的图片看起来像正方形而不是目前得到的矩形吗?谢谢。
2个回答

5

使用坐标轴的dataAspectRatio属性,将其设置为[1 1 1]

%# create a test image
imagesc(1:10,1:10,rand(10))

enter image description here

%# you should use the handle returned by subplot
%# instead of gca
set(gca,'dataAspectRatio',[1 1 1])

enter image description here


Jonas:谢谢你的回答。使用你提供的命令在subplot上可以显示一个图像,但是接着就出现了一个错误: ??? Error using ==> set There is no 'dataAspectRatio' property in the 'image' class. 我不确定为什么第一张图片没有问题,但是在第一张图片之后就会出现这个错误。你知道原因吗? - user238469
抱歉,那是我的错。我使用了imagesc()的句柄而不是你建议的subplot的句柄。还有一个后续问题:现在图像是正方形的,但它们的尺寸比第二行中的图像要小得多。您可以查看问题更新以查看相对大小。 - user238469

1

另一种方法是使用命令axis equal

关于不同对象的大小,您可以在图中设置每个轴的确切位置,例如对于第一个轴使用: subplot(2,2,1); set(gca,'Position',[0.05 0.05 0.4 0.4])


嗨。使用 set(gca,'Position',[0.05 0.05 0.4 0.4]) 会导致第一行的图像与第二行的第一张图像重叠。换句话说,由于图像重叠,图像位置的设置发生了变化。 - user238469

网页内容由stack overflow 提供, 点击上面的
可以查看英文原文,
原文链接