问题:是否可以在非均匀轴上说明图像?
详情:
我需要将一个多维时间序列说明为一幅图像。但是这个时间序列的时间网格非常不均匀。以下是一个例子:
m = 10;
n = 3;
t = sort(rand(m, 1));  % non-uniform time
values = randn(m, n);  % some random values
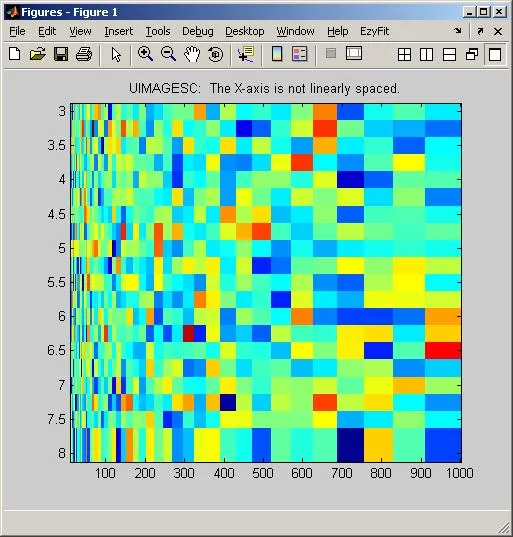
figure, imagesc(t, [], values);
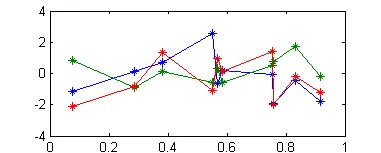
可以很好地处理figure, plot(t, values);。但是根据文档,imagesc()会将t转换为t(1)和t(end)之间的统一时间:
imagesc(x,y,C)将C显示为图像,并使用向量x和y指定x和y轴的范围。
因此,命令:
figure, imagesc(t, [], values);
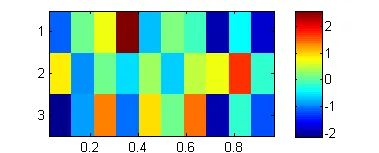
figure, imagesc(t, 1 : n, values'); colorbar;
在统一的时间网格上说明图像。
编辑:可以使用更高的统一分辨率重新采样时间序列。但我的时间序列已经非常大了。