使用K-means聚类准确检测图像中的颜色区域

4

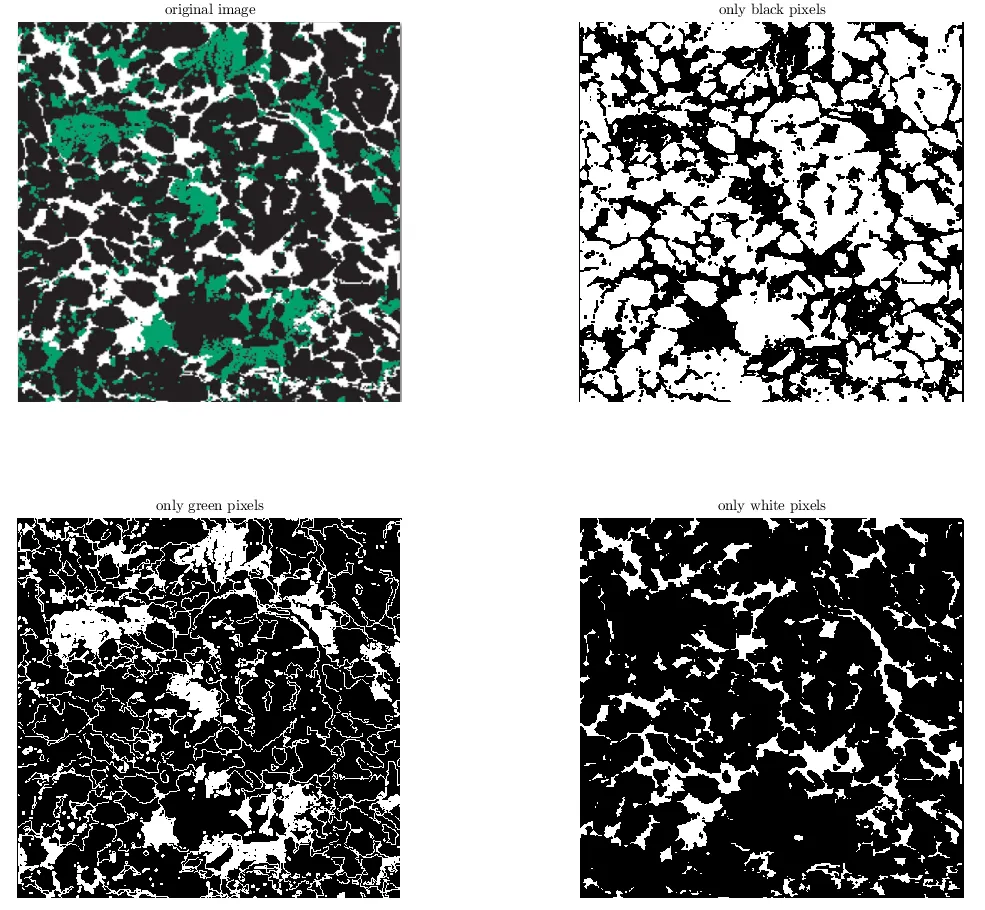
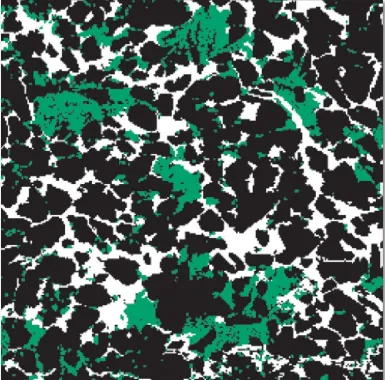
我正在使用基于颜色的图像分割中的K-means聚类算法。我有一张2D图像,其中包含三种颜色:黑色、白色和绿色。这是图片:

enter image description here

我希望K-means能够产生3个簇,其中一个代表绿色区域,第二个代表白色区域,最后一个代表黑色区域。
这是我使用的代码:
%Clustering color regions in an image. 

%Step 1: read the image using imread, and show it using imshow. 

img =  (imread('img.jpg'));

figure, imshow(img), title('X axis rock cut'); %figure is for creating a figure window.
text(size(img,2),size(img,1)+15,...
     'Unconventional shale x axis cut', ...
     'FontSize',7,'HorizontalAlignment','right');

 %Step 2: Convert Image from RGB Color Space to L*a*b* Color Space
 conversionform = makecform('srgb2lab'); %the form of the conversion is defined as from rgb to l a b
 lab_img = applycform(img,conversionform); %converting the rgb image to l a b image using the conversion form defined above.

 %Step 3: Classify the Colors in 'a*b*' Space Using K-Means Clustering
 ab = double(lab_img(:,:,2:3));
 nrows = size(ab,1);
 ncols = size(ab,2);
 ab = reshape(ab,nrows*ncols,2);

 nColors = 3;
% repeat the clustering 3 times to avoid local minima
[cluster_idx, cluster_center] = kmeans(ab,nColors,'distance','sqEuclidean', ...
                                      'Replicates',3);
%Step 4: Label Every Pixel in the Image Using the Results from KMEANS

%For every object in your input, kmeans returns an index corresponding to a cluster. The cluster_center output from kmeans will be used later in the example. Label every pixel in the image with its cluster_index.

pixel_labels = reshape(cluster_idx,nrows,ncols);
figure, imshow(pixel_labels,[]), title('image labeled by cluster index');

segmented_images = cell(1,3);
rgb_label = repmat(pixel_labels,[1 1 3]);

for k = 1:nColors
    color = img;
    color(rgb_label ~= k) = 0;
    segmented_images{k} = color;
end

figure, imshow(segmented_images{1}), title('objects in cluster 1');
figure, imshow(segmented_images{2}), title('objects in cluster 2');
figure, imshow(segmented_images{3}), title('objects in cluster 3');

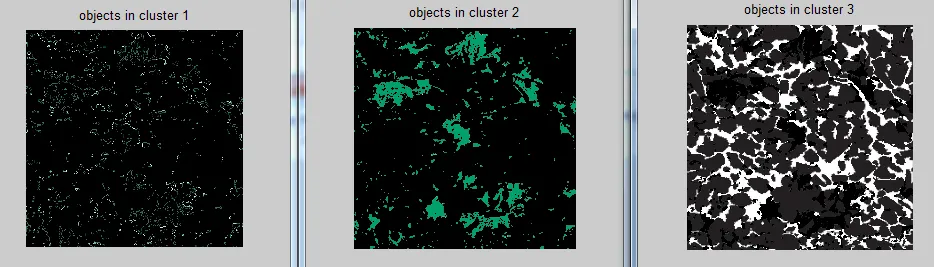
但是我没有得到所需的结果。我得到了一个带有绿色区域的聚类、一个带有绿色区域边界的聚类和一个带有灰色、黑色和白色颜色的聚类。以下是产生的聚类。

enter image description here

这样做的目的是在获得正确的聚类结果后,使用连通组件的概念计算每个区域中像素的数量。
因此,我的目标是知道每个颜色区域中有多少像素。我尝试通过获取2D图像的矩阵并尝试找出每种颜色的像素数量来采用另一种更简单的方法。然而,我在矩阵中发现了超过3个RGB颜色,可能是因为相同颜色的像素具有略微不同的颜色级别。这就是为什么我去进行图像分割的原因。
请问有人可以告诉我如何修复上面的代码以获得所需的结果吗?
如果有更简单的方法,请给我提示,我也会非常感激。
编辑:这里是我编写的迭代遍历图像中每个像素的代码。请注意,我使用红色、黄色、蓝色和白色这4种颜色,而不是绿色、白色和黑色,但思路是相同的。rgb2name是一个函数,它返回给定RGB颜色的颜色名称。
im= imread ('img.jpg'); 

[a b c] = size (im); 
%disp ([a b]);
yellow=0; 
blue=0; 
white=0; 
red=0; 


for i=1:a
    for j=1:b
        x= impixel(im, i, j)/255 ;
        color= rgb2name (x);
        if (~isempty (strfind (color, 'yellow')))
            yellow= yellow+1; 
        elseif (~isempty (strfind(color, 'red')))
            red= red+1; 
        elseif (~isempty (strfind (color, 'blue')))
            blue= blue+1; 
        elseif (~isempty (strfind (color, 'white')))
           white= white+1; 
        else 
            %disp ('warning'); break; 
        end            
        disp (color);
        disp (i);
    end
end
disp (yellow)
disp (red)
disp (blue)
disp (white)

谢谢。


2
这是因为您的图像中没有恰好3种颜色。由于jpg压缩,在锐利边缘附近会产生伪影,从而生成其他颜色。此外,在Lab空间中,a和b在此图像中不太具有区分性。如果您可以发布未压缩的图像(如png),那将更容易(不要将jpg转换为png,而是直接从数据中保存图像为png)。 - Miki
1
你可以相当快地计算每种颜色的像素数。问题在于你不只有3种颜色!所以你有几个选择:1)处理未压缩的图像(没有压缩伪影);2)找到3个主要颜色,并将抗锯齿生成的颜色分配给其中一种颜色。我强烈建议选择1)。如果你可以访问原始数据,这将会简单得多。如果你不能执行1),那么黑色、白色和绿色的颜色是否总是完全相同? - Miki
1
发布包含两个嵌套循环的代码。 - Miki
@Miki,我已经发布了代码,请检查一下。谢谢。 - Dania
谢谢@Miki,是的,没错:D。1)我只有黄色、红色、白色和蓝色。绿色、黑色和白色只是问题中的例子。图像中的任何RGB值都将映射到某种颜色。例如,即使有浅蓝色,它也会被映射为蓝色,因为只有蓝色可用来表示任何蓝色级别。因此,浅蓝色的最近邻将是蓝色。2)是的,我只有红色、黄色、蓝色和白色。在视觉上,你只看到每个颜色的一个级别,但函数产生不同的级别。因此,我为每种颜色定义了一个级别。好的,我会等待的。非常感谢。 - Dania
显示剩余3条评论
3个回答

3
我认为这个问题非常有趣,如果答案有点过度解释,我提前道歉。简而言之,k-means通常是在想将图像分割成离散的颜色空间时选择的正确策略。但是,您的示例图像仅包含三种颜色,每种颜色在颜色空间中都很好地分离,因此可以使用直方图轻松分段。请参见以下内容,以了解使用阈值进行分段的方法。
您可以通过对每个矩阵求和来轻松获得像素计数。例如:bCount = sum(blackPixels(:))
filename = '379NJ.png';
x = imread(filename); 
x = double(x); % cast to floating point
x = x/max(max(max(x))); % normalize

% take histogram of green dimension
g = x(:, :, 2);
c = hist(g(:), 2^8);

% smooth the hist count 
c = [zeros(1, 10), c, zeros(1, 10)];
N = 4;
for i = N+1:length(c) - N; 
   d(i - N) = mean(c(i -N:i)); 
end
d = circshift(d, [1, N/2]);

% as seen in histogram, the three colors fall nicely into 3 peaks
figure, plot(c, '.-');
[~, clusterCenters] = findpeaks(d, 'MinPeakHeight', 1e3);

% set the threshold halfway between peaks 
boundaries = [floor((clusterCenters(2) - clusterCenters(1))/2), ...
                 clusterCenters(2) + floor((clusterCenters(3) - clusterCenters(2))/2)];
thresh1 = boundaries(1)*ones(size(g))/255;
thresh2 = boundaries(2)*ones(size(g))/255;

% categorize based on threshold
blackPixels = g < thresh1;
greenPixels = g >= thresh1 & g < thresh2;
whitePixels = g >= thresh2;

Image segmentation


谢谢您的回答。我尝试运行代码,但是对于x = double(x)/(max(max(max(double)))),我得到了一个错误,说输入参数不够。所以我把它改成了x= double (x),然后运行了代码。这样做正确吗?还有,当我运行代码时,我得到了一个蓝色曲线,代表两个峰值。这是我应该得到的吗,还是我做错了什么?还有一件事,请问,我有另一张图像,上面有黄色、蓝色、红色和白色。我想知道前三种颜色的数量(剩下的是白色)。所以我们有3个聚类。我可以使用您发布的相同代码吗,还是需要更改? - Dania
1
我修复了导致你出错的拼写错误。在运行代码后,请尝试对每个*Pixels变量使用imshow。它们应该看起来像附图。另外,请注意,正如我在答案中提到的那样,这种策略适用于您提供的图像,而不是通用的。但是,如果将图像分成一小组(例如5个或更少)不同的颜色,则通过直方图进行分割应该可以正常工作。但是,它可能需要针对每种情况进行调整。 - crowdedComputeeer
非常感谢。那么如何检测黄色、红色和蓝色呢?如果这是一个基础问题,我很抱歉,因为我还是个初学者。我能做到吗?需要什么阈值?谢谢。 - Dania

2
这是我计算每个区域像素数量的方法。鉴于(如评论中所讨论的):
  • 颜色值(RGB)和颜色数量(K)是先验已知的
  • 压缩伪影和抗锯齿产生了额外的颜色,必须将其视为K个已知颜色中最近邻。
由于您事先知道颜色,因此不需要使用k-means。实际上,在您提出的问题中可能会导致糟糕的结果。@crowdedComputeeer的方法考虑到了这一方面。
您可以直接在像素值上使用pdist2计算最近邻。没有必要使用查找颜色名称的真正缓慢的函数。
下面是代码。您只需修改colors变量的数量和值即可计算每种颜色的像素数量,并输出掩模。
img =  (imread('path_to_image'));

colors = [  0 0 0;    % black
            0 1 0;    % green
            1 1 1];   % white


% % You can change the colors        
% colors = [  0 0 1;    % red
%             1 1 0;    % yellow
%             1 0 0;    % blue
%             1 1 1];   % white


% Find nearest neighbour color
list = double(reshape(img, [], 3)) / 255;
[~, IDX] = pdist2(colors, list, 'euclidean', 'Smallest', 1);
% IDX contains the indices to the nearest element


N = zeros(size(colors, 1), 1);
for i = 1 : size(colors, 1)
    % Count the number of pixels for each color
    N(i) = sum( IDX == i );
end

% This will display the number of pixels for each color
disp(N);


% Eventually build the masks
indices = reshape(IDX, [size(img,1), size(img,2)]);

figure();
szc = size(colors,1);
for i = 1 : szc
    subplot(1,szc,i);
    imagesc(indices == i);
end

计算结果如下:

97554     % black
16894     % green
31852     % white

生成的掩码:

输入图片描述


非常感谢,这很棒。但是,我在图像中有一个红色(不是确切的红色),但我得到的红色计数为0。为什么会发生这种情况?谢谢。 - Dania
@Dania,你能分享一下那张图片吗?这样我就可以弄清楚了。 - Miki
很遗憾,我不能分享它,因为它不是我的。我们可以在数组中包含不同的红色级别吗?也许这样它就能捕捉到了? - Dania
@Dania,你可以1)检查你的“几乎红色”像素的值,并将这些值用于数组中的“红色”。2)在colors中添加任意数量的颜色(请注意数字K会增加)。 - Miki
非常感谢。我会尝试一下。您所说的k是指每种颜色的计数吗? - Dania
1
@Dania,你将图像分成K种颜色(K = 4代表红、黄、蓝、白)。这对应于“colors”的行数。如果你添加一种颜色(例如深红、红、黄、蓝、白),那么K就变成了5,你实际上是将像素分成了5组。 - Miki

-1

网页内容由stack overflow 提供, 点击上面的
可以查看英文原文,
原文链接