我一直在寻找一种将坐标列表(x,y,z)发送到jzy3d的方法,但没有成功。
我唯一找到的方法是使用一个“builder”,其中包含一个“coord3d”列表和一个“tesselator”,但实际上并不起作用。
实际上,我并不明白Tesselator的意义是什么?
以下是我尝试过的代码:
请问如何用多个XYZ坐标来填充我的图形,以便像这样得到一个三维表面图: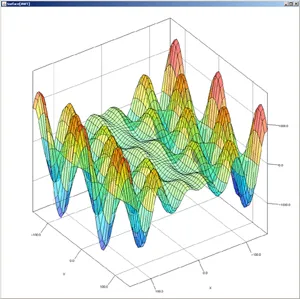 (图片来源:free.fr)
我唯一找到的方法是使用一个“builder”,其中包含一个“coord3d”列表和一个“tesselator”,但实际上并不起作用。
实际上,我并不明白Tesselator的意义是什么?
以下是我尝试过的代码:
public Chart getChart(){

    List<Coord3d> coordinates = new ArrayList<Coord3d>();
    for(int i=0; i<200; i++)
        coordinates.add( new Coord3d(5, 10, 15) );
    Tesselator tesselator = new Tesselator() {
        @Override
        public AbstractComposite build(float[] x, float[] y, float[] z) {
            return null;
        }
    };
    tesselator.build(coordinates);
     org.jzy3d.plot3d.primitives.Shape surface = (Shape)Builder.build(coordinates, tesselator);


/*/ Define a function to plot
  Mapper mapper = new Mapper(){
     public double f(double x, double y) {
        return 10*Math.sin(x/10)*Math.cos(y/20)*x;
     }
  };*/

  // Define range and precision for the function to plot
 // Range range = new Range(-150,150);
 // int steps   = 50;

  // Create the object to represent the function over the given range.
 // org.jzy3d.plot3d.primitives.Shape surface = (Shape)Builder.buildOrthonormal(new OrthonormalGrid(range, steps, range, steps), mapper);
  //surface.setColorMapper(new ColorMapper(new ColorMapRainbow(), surface.getBounds().getZmin(), surface.getBounds().getZmax(), new Color(1,1,1,.5f)));
 // surface.setWireframeDisplayed(true);
//  surface.setWireframeColor(Color.BLACK);
  //surface.setFace(new ColorbarFace(surface));
  //surface.setFaceDisplayed(true);
  //surface.setFace2dDisplayed(true); // opens a colorbar on the right part of the display

  // Create a chart
  Chart chart = new Chart("swing");
  chart.getScene().getGraph().add(surface);
  return chart;
}
请问如何用多个XYZ坐标来填充我的图形,以便像这样得到一个三维表面图:
(图片来源:free.fr)