能否从现有的matplotlib图形对象中创建子图?

5

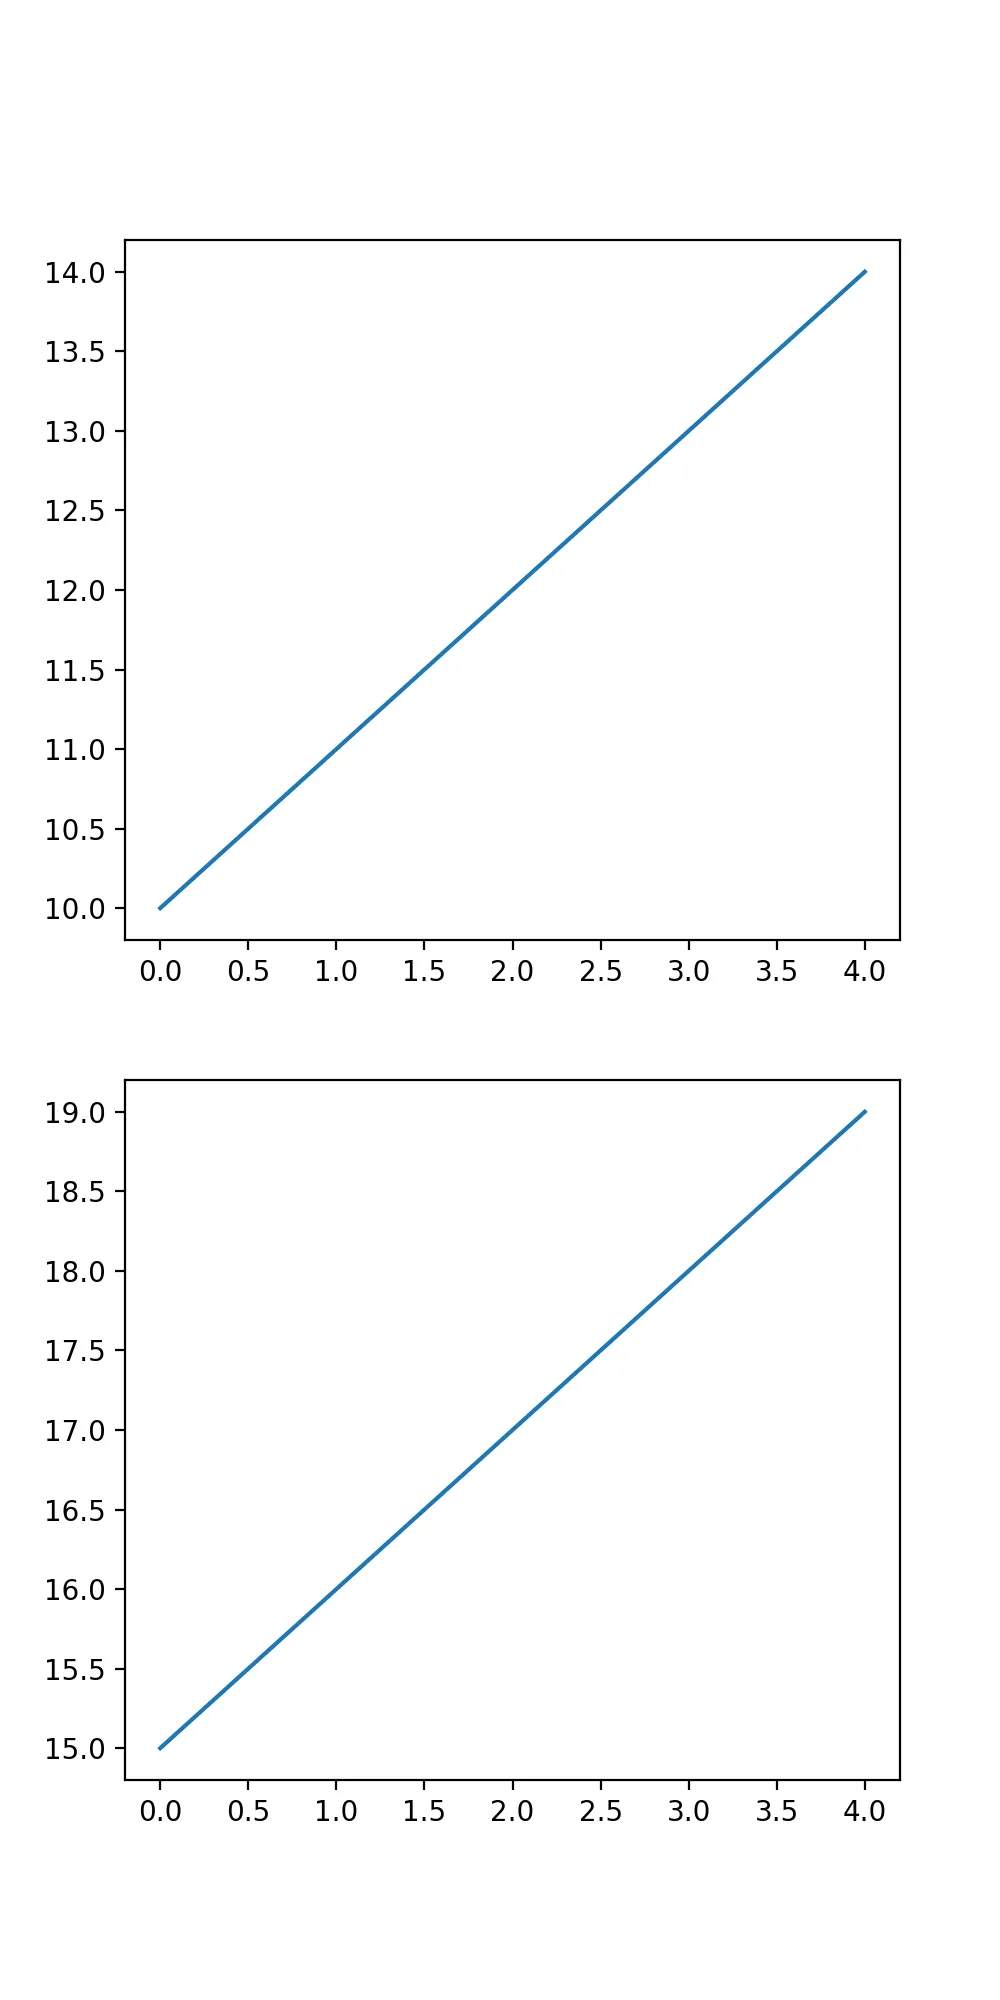
我有一个包含相同x轴的预先存在的图形列表,我想将它们堆叠在同一画布上。例如,这里我单独生成了两个图形 - 我该如何将它们放在一个图中?

import matplotlib.pyplot as plt

time = [0, 1, 2, 3, 4]
y1 = range(10, 15)
y2 = range(15, 20)

## Plot figure 1
fig1 = plt.figure()
plt.plot(time, y1)

## plot figure 2
fig2 = plt.figure()
plt.plot(time, y2)

## collect in a list
figs = [fig1, fig2]

plt.subplot(1, 1, 1)
## code to put fig1 here

plt.subplot(1, 1, 2)
## code to put fig2 here

这是不可能的。每个画布上只有一个图形。理论上,您可以将艺术家从一个图形移动到另一个图形,但这真的很麻烦(我有一个关于如何做到这一点的答案,但我不会链接到它,因为这真的不被推荐)。相反,您应该在一个图形内创建艺术家。设计原则是创建绘制轴的函数。使用来自某些图形的唯一轴或来自具有多个轴的图形中的一个轴调用这些函数。 - ImportanceOfBeingErnest
好的,谢谢你的建议。 - CiaranWelsh
1个回答

2

是的:

import matplotlib.pyplot as plt
from matplotlib import gridspec

time = [0, 1, 2, 3, 4]
y1 = range(10, 15)
y2 = range(15, 20)

plt.figure(figsize = (5,10))
fig = gridspec.GridSpec(2, 1, height_ratios=[1,1])

x1 = plt.subplot(fig[0])
plt.plot(time, y1)

x2 = plt.subplot(fig[1])
plt.plot(time, y2)

输出:

在这里输入图片描述


嗨。谢谢回答。GridSpec看起来很有前途,但我有一个现有的图形对象列表(因为我有一个函数的输出,我不想修改)。是否可能从这些现有的图形对象创建新图形? - CiaranWelsh
1
我不知道是否可以将两个图形连接在一起,但我倾向于认为不行。尝试理解这篇帖子:https://dev59.com/NGEh5IYBdhLWcg3wWySr。祝你好运,CiaranWelsh。 - B.Gees

网页内容由stack overflow 提供, 点击上面的
可以查看英文原文,
原文链接