如何在GGPLOT中仅移除两个图例中的一个

13

我有以下代码:

library(ggplot2)

df     <- data.frame(iris)                   # iris dataset
pca    <- prcomp(df[,1:4], retx=T, scale.=T) # scaled pca [exclude species col]
scores <- pca$x[,1:3]                        # scores for first three PC's

# k-means clustering [assume 3 clusters]
km     <- kmeans(scores, centers=3, nstart=5)
ggdata <- data.frame(scores, Cluster=km$cluster, Species=df$Species)

# stat_ellipse is not part of the base ggplot package
source("https://raw.githubusercontent.com/tidyverse/ggplot2/master/R/stat-ellipse.R")


ggplot(ggdata) +
  geom_point(aes(x=PC1, y=PC2, color=factor(Species)), size=5, shape=20) +
  stat_ellipse(aes(x=PC1,y=PC2,fill=factor(Species)),
               geom="polygon", level=0.95, alpha=0.2) +
  guides(color=guide_legend("Species"),fill=guide_legend("Cluster"))

这将产生以下结果:

enter image description here

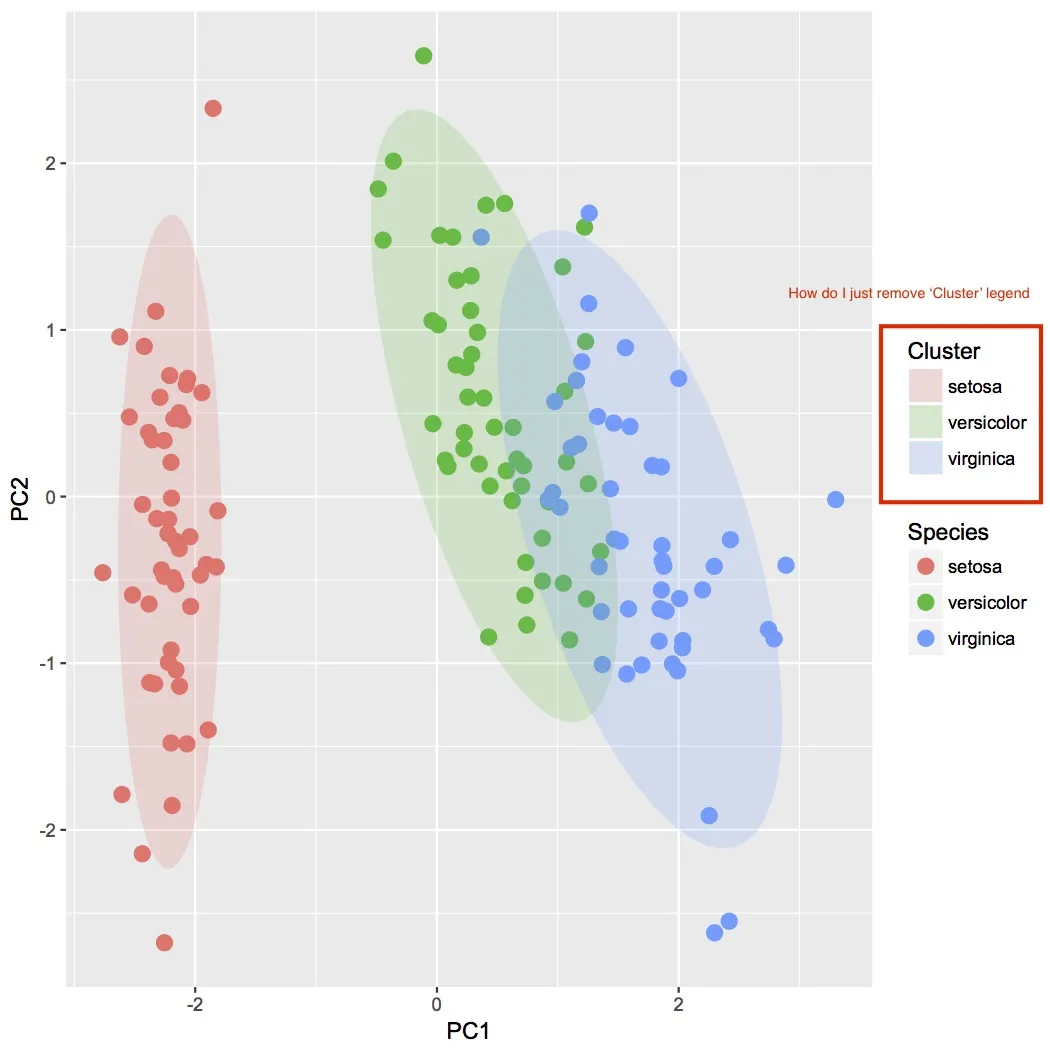
如图所示,我该如何只删除“Cluster”图例?

1个回答

20

将您的填充指南设置为“无”

 ggplot(ggdata) +
   geom_point(aes(x=PC1, y=PC2, color=factor(Species)), size=5, shape=20) +
     stat_ellipse(aes(x=PC1,y=PC2, fill=factor(Species)),
                                 geom="polygon", level=0.95, alpha=0.2)+
      guides(color=guide_legend("Species"), fill = "none")

编辑:20221129-根据以下内容将scale = FALSE更改为scale = "none"

guides()<scale> 参数不能为 FALSE。从 ggplot2 3.3.4 开始,请改用“none”。


使用<scale>=FALSE的方式现已弃用,因此当前的语法是:ggplot(ggdata) + geom_point(aes(x=PC1, y=PC2, color=factor(Species)), size=5, shape=20) + stat_ellipse(aes(x=PC1,y=PC2, fill=factor(Species)), geom="polygon", level=0.95, alpha=0.2)+ guides(color=guide_legend("Species"), fill = "none") - andyyy

网页内容由stack overflow 提供, 点击上面的
可以查看英文原文,
原文链接