如何使用PyTorch可视化卷积神经网络中的过滤器

10
我是深度学习和Pytorch的新手。我想在我的CNN模型中可视化滤波器,以便可以迭代我定义的CNN模型中的层。但我遇到了如下错误。 错误信息:'CNN' object is not iterable。 CNN对象是我的模型。 我的迭代代码如下:
for index, layer in enumerate(self.model):             
# Forward pass layer by layer
    x = layer(x)

我的模型代码如下:

class CNN(nn.Module):
    def __init__(self):
        super(CNN,self).__init__()
        self.Conv1 = nn.Sequential( # input image size (1,28,20)
            nn.Conv2d(1, 16, 5, 1, 2), # outputize (16,28,20)
            nn.ReLU(),
            nn.MaxPool2d(2),           #outputize (16,14,10)
        )
        self.Conv2 = nn.Sequential( # input ize ? (16,,14,10)
            nn.Conv2d(16, 32, 5, 1, 2),   #output size(32,14,10)
            nn.ReLU(),
            nn.MaxPool2d(2),        #output size (32,7,5)
        )
        self.fc1 = nn.Linear(32 * 7 * 5, 800) 
        self.fc2 = nn.Linear(800,500)
        self.fc3 = nn.Linear(500,10)
        #self.fc4 = nn.Linear(200,10)
        
    def forward(self,x):
        x = self.Conv1(x)
        x = self.Conv2(x)
        x = x.view(x.size(0), -1)
        x = self.fc1(x)
        x = F.dropout(x)
        x = F.relu(x)
        x = self.fc2(x)
        x = F.dropout(x)
        x = F.relu(x)
        x = self.fc3(x)
        #x = F.relu(x)
        #x = self.fc4(x)
        return x

有人能告诉我如何解决这个问题吗?


什么是可视化滤波器? - Szymon Maszke
类似于这个链接,但我想使用PyTorch实现它,所以我想在模型中迭代层。 - kapike
3个回答

13

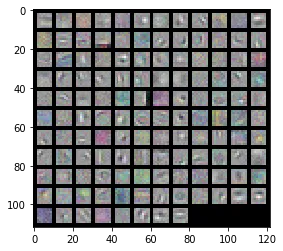
基本上,您需要访问模型中的特征并首先将这些矩阵转置为正确的形状,然后才能可视化过滤器。

    import numpy as np
    import matplotlib.pyplot as plt
    from torchvision import utils

    def visTensor(tensor, ch=0, allkernels=False, nrow=8, padding=1): 
        n,c,w,h = tensor.shape

        if allkernels: tensor = tensor.view(n*c, -1, w, h)
        elif c != 3: tensor = tensor[:,ch,:,:].unsqueeze(dim=1)

        rows = np.min((tensor.shape[0] // nrow + 1, 64))    
        grid = utils.make_grid(tensor, nrow=nrow, normalize=True, padding=padding)
        plt.figure( figsize=(nrow,rows) )
        plt.imshow(grid.numpy().transpose((1, 2, 0)))


    if __name__ == "__main__":
        layer = 1
        filter = model.features[layer].weight.data.clone()
        visTensor(filter, ch=0, allkernels=False)

        plt.axis('off')
        plt.ioff()
        plt.show()

您应该能够获得网格视觉。 输入图像描述

还有一些其他的可视化技术,您可以在这里学习它们。


1
FYI - 根据Pytorch文档(https://pytorch.org/docs/stable/generated/torch.nn.Conv2d.html),我认为张量的形状应该是`n,c,h,w`。 - matt
1
它抛出了AttributeError错误:“CNNModel”对象没有“features”属性,有人能告诉我为什么吗。非常感谢。 - DennisLi

8
首先,让我陈述一些事实以避免混淆。卷积层(也称为滤波器)由内核组成。当我们说我们使用的内核大小为3或(3,3)时,内核的实际形状是三维的而不是二维的。内核的深度与卷积层输入中通道的数量相匹配。例如,输入图像形状(CxHxW)为(3,128,128),现在我们应用一个输出通道数为128和内核大小为3的Conv层。
self.conv1 = nn.Conv2d(in_channels=3, out_channels=128, kernel_size=8, stride = 4, padding = 2)

输出的形状将是(128、32、32),内核的形状将是(3、8、8),过滤器的形状将是(num_kernels、kernel_depth、kernel_height、kernel_width):(128、3、8、8)。过滤器中的内核数与输出通道数相同。 由于第一层的过滤器根据输入图像是灰度图像还是彩色图像,其深度维度为1或3,因此很容易可视化它们。
# instantiate model
conv = ConvModel()

# load weights if they haven't been loaded
# skip if you're directly importing a pretrained network
checkpoint = torch.load('model_weights.pt')
conv.load_state_dict(checkpoint)


# get the kernels from the first layer
# as per the name of the layer
kernels = conv.first_conv_layer.weight.detach().clone()

#check size for sanity check
print(kernels.size())

# normalize to (0,1) range so that matplotlib
# can plot them
kernels = kernels - kernels.min()
kernels = kernels / kernels.max()
filter_img = torchvision.utils.make_grid(kernels, nrow = 12)
# change ordering since matplotlib requires images to 
# be (H, W, C)
plt.imshow(filter_img.permute(1, 2, 0))

# You can directly save the image as well using
img = save_image(kernels, 'encoder_conv1_filters.png' ,nrow = 12)

filters of an autoencoder


第二层呢?例如 [32,16,5,5] 怎么可视化? - Kevin Patel

2
def imshow_filter(img,row,col):
    print('-------------------------------------------------------------')
    plt.figure()
    for i in range(len(filters)):
        w = np.array([0.299, 0.587, 0.114]) #weight for RGB
        img = filters[i]
        img = np.transpose(img, (1, 2, 0))
        img = img/(img.max()-img.min())
        img = np.dot(img,w)

        plt.subplot(row,col,i+1)
        plt.imshow(img,cmap= 'gray')
        plt.xticks([])
        plt.yticks([])
    plt.show()
# swap color axis because
# numpy image: H x W x C
# torch image: C X H X W
filters = net.conv1.weight.data.cpu().numpy()
imshow_filter(filters)

这应该适用于你的代码


我得到了 TypeError: imshow_filter() missing 2 required positional arguments: 'row' and 'col' 这是应该是哪些值? - mokiliii Lo
行和列是可视化图像的行数和列数。例如,如果您的第一层有32个过滤器,您可以将它们显示为4 x 8或8 x 4的图像,或者如果行 * 列=您的过滤器数量,您也可以选择其他的方式。 - Jiaqi liu

网页内容由stack overflow 提供, 点击上面的
可以查看英文原文,
原文链接