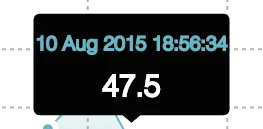
我在d3js线性图表中发现了一个黑色工具提示细节弹出,并希望增加其大小。有人知道如何在这个线性图表中增加工具提示的大小吗?我尝试过一些方法,但是无法找到如何增加或减少它的大小。
 任何帮助都将非常感激,以克服这个问题。
;( function() {
  var data = {
    lineChart : [
      {
        date  : '2006-02-22',
        label : 'foo',
        value : 950
      },
      {
        date  : '2006-08-22',
        label : 'bar',
        value : 1000
      },
      {
        date  : '2007-01-11',
        label : 'baz',
        value : 700
      },
      {
        date  : '2008-10-01',
        label : 'boing',
        value : 534
      },
      {
        date  : '2009-02-24',
        label : 'loool',
        value : 1423
      },
      {
        date  : '2010-12-30',
        label : 'YEAH',
        value : 1222
      },
      {
        date  : '2011-05-15',
        label : 'Hurray',
        value : 948
      },
      {
        date  : '2012-04-02',
        label : 'WTF',
        value : 1938
      },
      {
        date  : '2013-08-19',
        label : 'OMG',
        value : 1245
      },
      {
        date  : '2013-11-11',
        label : 'ROFL',
        value : 888
      }
    ],
    pieChart  : [
      {
        color       : 'red',
        description : 'Ipsem lorem text goes here. And foo goes bar goes baz. That\'s up!!!',
        title       : 'flowers',
        value       : 0.62
      },
      {
        color       : 'blue',
        description : 'Another ipsem text goes here. And baz goes bar goes foo. Oh yeah, whazzz up?',
        title       : 'trains',
        value       : 0.38
      }
    ]
  };

  var DURATION = 1500;
  var DELAY    = 500;

  /**
   * draw the fancy line chart
   *
   * @param {String} elementId elementId
   * @param {Array}  data      data
   */
  function drawLineChart( elementId, data ) {
    // parse helper functions on top
    var parse = d3.time.format( '%Y-%m-%d' ).parse;
    // data manipulation first
    data = data.map( function( datum ) {
      datum.date = parse( datum.date );

      return datum;
    } );

    // TODO code duplication check how you can avoid that
    var containerEl = document.getElementById( elementId ),
        width       = containerEl.clientWidth,
        height      = width * 0.4,
        margin      = {
          top    : 30,
          right  : 10,
          left   : 10
        },

        detailWidth  = 98,
        detailHeight = 55,
        detailMargin = 10,

        container   = d3.select( containerEl ),
        svg         = container.select( 'svg' )
                                .attr( 'width', width )
                                .attr( 'height', height + margin.top ),

        x          = d3.time.scale().range( [ 0, width - detailWidth ] ),
        xAxis      = d3.svg.axis().scale( x )
                                  .ticks ( 8 )
                                  .tickSize( -height ),
        xAxisTicks = d3.svg.axis().scale( x )
                                  .ticks( 16 )
                                  .tickSize( -height )
                                  .tickFormat( '' ),
        y          = d3.scale.linear().range( [ height, 0 ] ),
        yAxisTicks = d3.svg.axis().scale( y )
                                  .ticks( 12 )
                                  .tickSize( width )
                                  .tickFormat( '' )
                                  .orient( 'right' ),

        area = d3.svg.area()
                      .interpolate( 'linear' )
                      .x( function( d )  { return x( d.date ) + detailWidth / 2; } )
                      .y0( height )
                      .y1( function( d ) { return y( d.value ); } ),

        line = d3.svg.line()
                  .interpolate( 'linear' )
                  .x( function( d ) { return x( d.date ) + detailWidth / 2; } )
                  .y( function( d ) { return y( d.value ); } ),

        startData = data.map( function( datum ) {
                      return {
                        date  : datum.date,
                        value : 0
                      };
                    } ),

        circleContainer;

    // Compute the minimum and maximum date, and the maximum price.
    x.domain( [ data[ 0 ].date, data[ data.length - 1 ].date ] );
    // hacky hacky hacky :(
    y.domain( [ 0, d3.max( data, function( d ) { return d.value; } ) + 700 ] );

    svg.append( 'g' )
        .attr( 'class', 'lineChart--xAxisTicks' )
        .attr( 'transform', 'translate(' + detailWidth / 2 + ',' + height + ')' )
        .call( xAxisTicks );

    svg.append( 'g' )
        .attr( 'class', 'lineChart--xAxis' )
        .attr( 'transform', 'translate(' + detailWidth / 2 + ',' + ( height + 7 ) + ')' )
        .call( xAxis );

    svg.append( 'g' )
      .attr( 'class', 'lineChart--yAxisTicks' )
      .call( yAxisTicks );

    // Add the line path.
    svg.append( 'path' )
        .datum( startData )
        .attr( 'class', 'lineChart--areaLine' )
        .attr( 'd', line )
        .transition()
        .duration( DURATION )
        .delay( DURATION / 2 )
        .attrTween( 'd', tween( data, line ) )
        .each( 'end', function() {
          drawCircles( data );
        } );


    // Add the area path.
    svg.append( 'path' )
        .datum( startData )
        .attr( 'class', 'lineChart--area' )
        .attr( 'd', area )
        .transition()
        .duration( DURATION )
        .attrTween( 'd', tween( data, area ) );

    // Helper functions!!!
    function drawCircle( datum, index ) {
      circleContainer.datum( datum )
                    .append( 'circle' )
                    .attr( 'class', 'lineChart--circle' )
                    .attr( 'r', 0 )
                    .attr(
                      'cx',
                      function( d ) {
                        return x( d.date ) + detailWidth / 2;
                      }
                    )
                    .attr(
                      'cy',
                      function( d ) {
                        return y( d.value );
                      }
                    )
                    .on( 'mouseenter', function( d ) {
                      d3.select( this )
                        .attr(
                          'class',
                          'lineChart--circle lineChart--circle__highlighted'
                        )
                        .attr( 'r', 7 );

                        d.active = true;

                        showCircleDetail( d );
                    } )
                    .on( 'mouseout', function( d ) {
                      d3.select( this )
                        .attr(
                          'class',
                          'lineChart--circle'
                        )
                        .attr( 'r', 6 );

                      if ( d.active ) {
                        hideCircleDetails();

                        d.active = false;
                      }
                    } )
                    .on( 'click touch', function( d ) {
                      if ( d.active ) {
                        showCircleDetail( d )
                      } else {
                        hideCircleDetails();
                      }
                    } )
                    .transition()
                    .delay( DURATION / 10 * index )
                    .attr( 'r', 6 );
    }

    function drawCircles( data ) {
      circleContainer = svg.append( 'g' );

      data.forEach( function( datum, index ) {
        drawCircle( datum, index );
      } );
    }

    function hideCircleDetails() {
      circleContainer.selectAll( '.lineChart--bubble' )
                      .remove();
    }

    function showCircleDetail( data ) {
      var details = circleContainer.append( 'g' )
                        .attr( 'class', 'lineChart--bubble' )
                        .attr(
                          'transform',
                          function() {
                            var result = 'translate(';

                            result += x( data.date );
                            result += ', ';
                            result += y( data.value ) - detailHeight - detailMargin;
                            result += ')';

                            return result;
                          }
                        );

      details.append( 'path' )
              .attr( 'd', 'M2.99990186,0 C1.34310181,0 0,1.34216977 0,2.99898218 L0,47.6680579 C0,49.32435 1.34136094,50.6670401 3.00074875,50.6670401 L44.4095996,50.6670401 C48.9775098,54.3898926 44.4672607,50.6057129 49,54.46875 C53.4190918,50.6962891 49.0050244,54.4362793 53.501875,50.6670401 L94.9943116,50.6670401 C96.6543075,50.6670401 98,49.3248703 98,47.6680579 L98,2.99898218 C98,1.34269006 96.651936,0 95.0000981,0 L2.99990186,0 Z M2.99990186,0' )
              .attr( 'width', detailWidth )
              .attr( 'height', detailHeight );

      var text = details.append( 'text' )
                        .attr( 'class', 'lineChart--bubble--text' );

      text.append( 'tspan' )
          .attr( 'class', 'lineChart--bubble--label' )
          .attr( 'x', detailWidth / 2 )
          .attr( 'y', detailHeight / 3 )
          .attr( 'text-anchor', 'middle' )
          .text( data.label );

      text.append( 'tspan' )
          .attr( 'class', 'lineChart--bubble--value' )
          .attr( 'x', detailWidth / 2 )
          .attr( 'y', detailHeight / 4 * 3 )
          .attr( 'text-anchor', 'middle' )
          .text( data.value );
    }

    function tween( b, callback ) {
      return function( a ) {
        var i = d3.interpolateArray( a, b );

        return function( t ) {
          return callback( i ( t ) );
        };
      };
    }
  }


  function ಠ_ಠ() {

    drawLineChart(    'lineChart',    data.lineChart );
  }

  // yeah, let's kick things off!!!
  ಠ_ಠ();

})();
/**
* Variable power
*/
* {
-moz-box-sizing: border-box;
box-sizing: border-box;
}
body {
font-size: 14px;
font-family: sans-serif;
font-weight: 100;
background-color: #ccc;
background-image: linear-gradient(transparent 50%, rgba(255, 255, 255, 0.5) 25%);
background-size: 4px 4px;
}
body ul {
list-style: none;
}
body ul, body li {
margin: 0;
padding: 0;
}
.chart {
min-height: 400px;
border-bottom: 1px solid #eee;
padding: 1em;
}
.chart--headline, .chart--subHeadline {
text-align: center;
}
.chart--headline {
position: relative;
font-weight: 100;
font-size: 28px;
}
.chart--headline:before {
position: absolute;
content: '';
bottom: 133%;
left: 50%;
width: 25%;
margin: 0 0 0 -12.5%;
border-top: 1px dashed #999999;
}
.chart--subHeadline {
font-weight: 400;
font-size: 14px;
letter-spacing: 1px;
}
.charts--container {
background-color: #fff;
width: 100%;
}
@media screen and (min-width: 700px) {
.charts--container {
max-width: 700px;
left: 50%;
top: 10%;
margin: 5em auto;
box-shadow: 0 2em 2em #333;
}
}
.charts--headline {
text-align: center;
color: #444;
background-color: #fff;
padding: 1em;
}
.lineChart--area {
fill: url(#lineChart--gradientBackgroundArea);
}
.lineChart--areaLine {
fill: none;
stroke: #6bb7c7;
stroke-width: 3;
}
.lineChart--bubble--label {
fill: none;
stroke: #6bb7c7;
font-size: 12.6px;
font-style: italic;
font-weight: 100;
}
.lineChart--bubble--value {
fill: #fff;
stroke: #fff;
font-size: 21px;
font-weight: 100;
}
.lineChart--circle {
fill: #6bb7c7;
stroke: #fff;
stroke-width: 3;
}
.lineChart--circle__highlighted {
fill: #fff;
stroke: #3f94a7;
}
.lineChart--gradientBackgroundArea--top {
stop-color: #6bb7c7;
stop-opacity: 0.1;
}
.lineChart--gradientBackgroundArea--bottom {
stop-color: #6bb7c7;
stop-opacity: 0.6;
}
.lineChart--svg {
border: 1px solid #eee;
}
.lineChart--xAxisTicks .domain, .lineChart--xAxis .domain, .lineChart--yAxisTicks .domain {
display: none;
}
.lineChart--xAxis .tick line {
display: none;
}
.lineChart--xAxisTicks .tick line, .lineChart--yAxisTicks .tick line {
fill: none;
stroke: #b3b3b3;
stroke-width: 1;
stroke-dasharray: 2,2;
}
/**
* Helper classes
*/
.hidden {
display: none;
}<script src="https://ajax.googleapis.com/ajax/libs/jquery/2.1.1/jquery.min.js"></script>
<script src="https://cdnjs.cloudflare.com/ajax/libs/d3/3.4.11/d3.min.js"></script>
<h1 class="charts--headline">Wanna check the code?<br>Click "Edit this pen" in left bottom corner.</h1>
<div class="charts--container">
<ul>
<li class="chart">
<div id="pieChart">
<svg id="pieChartSVG">
<defs>
<filter id='pieChartInsetShadow'>
<feOffset dx='0' dy='0'/>
<feGaussianBlur stdDeviation='3' result='offset-blur' />
<feComposite operator='out' in='SourceGraphic' in2='offset-blur' result='inverse' />
<feFlood flood-color='black' flood-opacity='1' result='color' />
<feComposite operator='in' in='color' in2='inverse' result='shadow' />
<feComposite operator='over' in='shadow' in2='SourceGraphic' />
</filter>
<filter id="pieChartDropShadow">
<feGaussianBlur in="SourceAlpha" stdDeviation="3" result="blur" />
<feOffset in="blur" dx="0" dy="3" result="offsetBlur" />
<feMerge>
<feMergeNode />
<feMergeNode in="SourceGraphic" />
</feMerge>
</filter>
</defs>
</svg>
</div>
</li>
<li class="chart">
<h3 class="chart--subHeadline">Chart 2</h3>
<h2 class="chart--headline">Area Label Would Go Here</h2>
<div id="lineChart">
<svg id="lineChartSVG" class="lineChart--svg">
<defs>
<linearGradient id="lineChart--gradientBackgroundArea" x1="0" x2="0" y1="0" y2="1">
<stop class="lineChart--gradientBackgroundArea--top" offset="0%" />
<stop class="lineChart--gradientBackgroundArea--bottom" offset="100%" />
</linearGradient>
</defs>
</svg>
</div>
</li>
</ul>
</div>