我一直在跟着这个类似的答案(这里),但是当使用sklearn和rolling apply时我有一些问题。我尝试使用rolling apply创建z-score并进行PCA,但是我一直收到'only length-1 arrays can be converted to Python scalars' error.的错误信息。
按照之前的示例,我创建了一个数据框。
from sklearn.preprocessing import StandardScaler
import pandas as pd
import numpy as np
sc=StandardScaler()
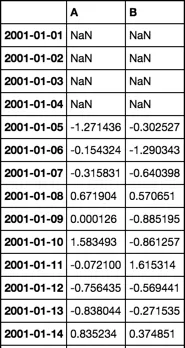
tmp=pd.DataFrame(np.random.randn(2000,2)/10000,index=pd.date_range('2001-01-01',periods=2000),columns=['A','B'])
如果我使用rolling命令:
 tmp.rolling(window=5,center=False).apply(lambda x: sc.fit_transform(x))
 TypeError: only length-1 arrays can be converted to Python scalars
我遇到了这个错误,但是我可以轻松创建具有平均值和标准偏差的函数,没有任何问题。
def test(df):
    return np.mean(df)
tmp.rolling(window=5,center=False).apply(lambda x: test(x))
我相信错误发生在我尝试用当前值减去均值以计算z-score时。
def test2(df):
    return df-np.mean(df)
tmp.rolling(window=5,center=False).apply(lambda x: test2(x))
only length-1 arrays can be converted to Python scalars
我如何使用sklearn创建自定义滚动函数,以首先标准化,然后运行PCA?
编辑: 我意识到我的问题不太清楚,所以我再试一次。我想要标准化我的值,然后运行PCA以获得每个因子解释的方差量。在没有滚动的情况下,这样做相当简单。
testing=sc.fit_transform(tmp)
pca=decomposition.pca.PCA() #run pca
pca.fit(testing)
pca.explained_variance_ratio_
array([ 0.50967441,  0.49032559])
在滚动时,我无法使用相同的过程。使用 @piRSquared 的滚动 zscore 函数可以得到 zscores。似乎 sklearn 的 PCA 与滚动应用自定义函数不兼容。(实际上,我认为大多数 sklearn 模块都是这种情况。)我只是试图获取解释方差,这是一个一维项,但以下代码返回了一堆 NaN。
def test3(df):
    pca.fit(df)
    return pca.explained_variance_ratio_
tmp.rolling(window=5,center=False).apply(lambda x: test3(x))
然而,我可以创建自己的解释方差函数,但这也不起作用。
def test4(df):
    cov_mat=np.cov(df.T) #need covariance of features, not observations
    eigen_vals,eigen_vecs=np.linalg.eig(cov_mat)
    tot=sum(eigen_vals)
    var_exp=[(i/tot) for i in sorted(eigen_vals,reverse=True)]
    return var_exp
tmp.rolling(window=5,center=False).apply(lambda x: test4(x))
我遇到了这个错误:给定一个零维数组。数组必须至少有两个维度。
简而言之,我想运行滚动z分数,然后运行滚动主成分分析,并输出每次滚动的解释方差。我已经完成了滚动z分数,但还没有解释方差。