const N = 10;
const dataGenerator = (plus = 600, minus = 400, pNull = 1) =>
Array.from({length: N}, ()=>Math.random() < pNull ?
Math.round(Math.random()*(plus+minus)-minus)/4 : null)
const ctx1 = document.getElementById('chart1');
new Chart(ctx1, {
type: "bar",
plugins: [ChartDataLabels],
data: {
labels: Array.from({length: N}, (_, i)=>'l'+(i+1)),
datasets: [
{
data: dataGenerator(),
stack: 'a',
},
{
data: dataGenerator() ,
stack: 'a',
},
{
data: dataGenerator(100, 50, 0.5),
stack: 'a',
},
]
},
options: {
indexAxis: 'x',
layout: {
padding: {
top: 20,
bottom: 20
}
},
animation: {
duration: 0
},
scales: {
x: {
ticks:{
display: false
}
},
y: {
stacked: true,
beginAtZero: true
}
},
plugins:{
legend:{
display: false
},
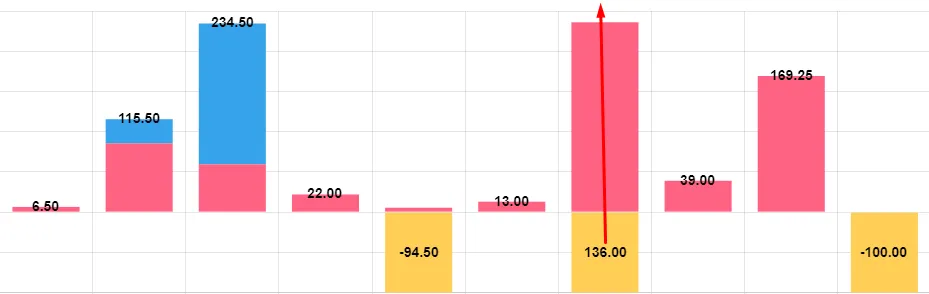
datalabels:{
formatter: (value, context) => {
const {dataIndex, datasetIndex, chart} = context;
const dataForDataIndex = chart.data.datasets.map(
dataset=>dataset.data[dataIndex] ?? 0
);
const total = dataForDataIndex.reduce((s, x)=>s+x)
const datasetIndexLast = dataForDataIndex.findLastIndex(x => x * total > 0);
context.total = total;
return datasetIndexLast === datasetIndex ? total.toFixed(2) : null
},
anchor: (context) => {
return context.total > 0 ? 'end' : 'start'
},
align: (context) => {
return context.total > 0 ? 'top' : 'bottom';
},
clip: false
}
}
}
});
<div style="height:500px">
    <canvas id="chart1"></canvas>
</div>
<script src="https://cdnjs.cloudflare.com/ajax/libs/Chart.js/4.3.0/chart.umd.js"
        integrity="sha512-CMF3tQtjOoOJoOKlsS7/2loJlkyctwzSoDK/S40iAB+MqWSaf50uObGQSk5Ny/gfRhRCjNLvoxuCvdnERU4WGg=="
        crossOrigin="anonymous" referrerpolicy="no-referrer"></script>
<script src="https://cdnjs.cloudflare.com/ajax/libs/chartjs-plugin-datalabels/2.2.0/chartjs-plugin-datalabels.min.js" integrity="sha512-JPcRR8yFa8mmCsfrw4TNte1ZvF1e3+1SdGMslZvmrzDYxS69J7J49vkFL8u6u8PlPJK+H3voElBtUCzaXj+6ig==" crossorigin="anonymous" referrerpolicy="no-referrer"></script>