任务是将下面的表格转换为:
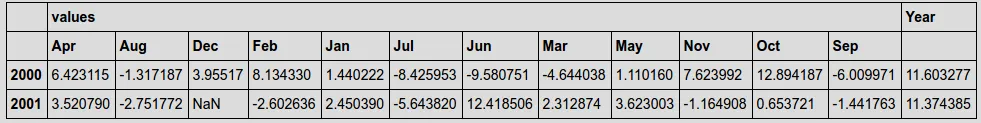
此外,我需要添加一列,将年度值相加,如下所示:
import pandas as pd
import numpy as np

index = pd.date_range('2000-1-1', periods=700, freq='D')
df = pd.DataFrame(np.random.randn(700), index=index, columns=["values"])

df.groupby(by=[df.index.year, df.index.month]).sum()

In[1]: df

Out[1]:
           values
2000 1   1.181000
     2  -8.005783
     3   6.590623
     4  -6.266232
     5   1.266315
     6   0.384050
     7  -1.418357
     8  -3.132253
     9   0.005496
     10 -6.646101
     11  9.616482
     12  3.960872
2001 1  -0.989869
     2  -2.845278
     3  -1.518746
     4   2.984735
     5  -2.616795
     6   8.360319
     7   5.659576
     8   0.279863
     9  -5.220678
     10  5.077400
     11  1.332519
使其看起来像这样
      Jan  Feb  Mar  Apr  May  Jun  Jul  Aug  Sep  Oct  Nov  Dec
2000  1.2  -8.0 6.6  -6.3 1.2  0.4  -1.4 -3.1 0.0  -6.6 9.6  3.9
2001  -0.9 -2.8 -1.5 3.0  -2.6 8.3  5.7  0.3  -5.2 5.1  1.3
此外,我需要添加一列,将年度值相加,如下所示:
      Jan  Feb  Mar  Apr  May  Jun  Jul  Aug  Sep  Oct  Nov  Dec  Year
2000  1.2  -8.0 6.6  -6.3 1.2  0.4  -1.4 -3.1 0.0  -6.6 9.6  3.9  4.7
2001  -0.9 -2.8 -1.5 3.0  -2.6 8.3  5.7  0.3  -5.2 5.1  1.3       10.7
有没有一种快速的pandas关键方法来解决这个问题?