@Eric已经进行了评论,但@akrun在链接中也进行了回答。通过对@akrun函数应用apply
函数,您还可以绘制DF
的所有点,类似于以下内容:
library(ggplot2)
X <- 1:5
Y <- c(2, 6, 4, 7, 12)
DF <- data.frame(X, Y)
draw_guides<- function(x, y) {
list(geom_segment(aes(x = -Inf, xend = x, y = y, yend = y), linetype = "dashed"),
geom_segment(aes(x = x, xend = x, y = y, yend = -Inf), linetype = "dashed"))
}
ggplot(data = DF,
aes(x = X,
y = Y)) +
geom_point() +
geom_line() +
apply(DF, 1, function(y) draw_guides(y[1], y[2]))
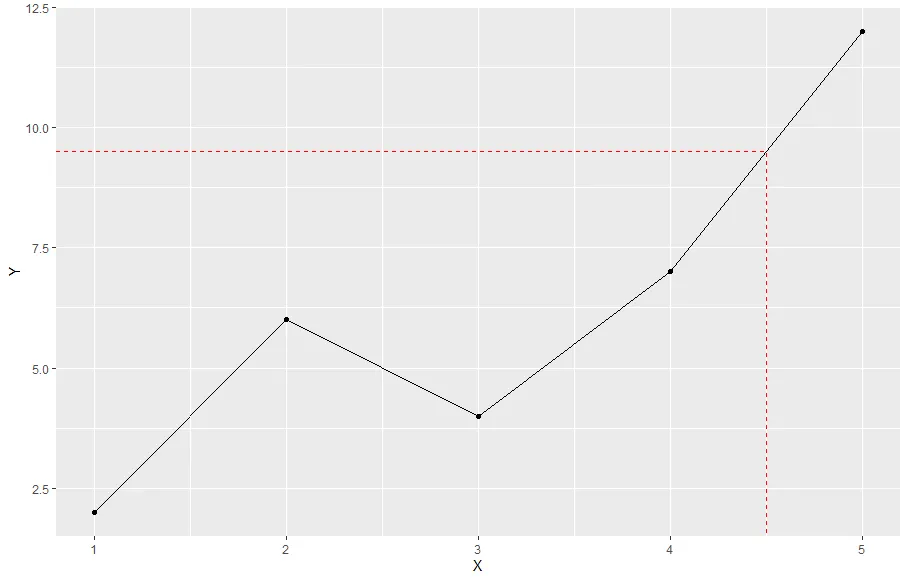
你也可以使用geom_path()来实现这个。
X <- 1:5
Y <- c(2, 6, 4, 7, 12)
DF <- data.frame(X, Y)
ggplot(data = DF, aes(x = X, y = Y)) +
geom_point() +
geom_line() +
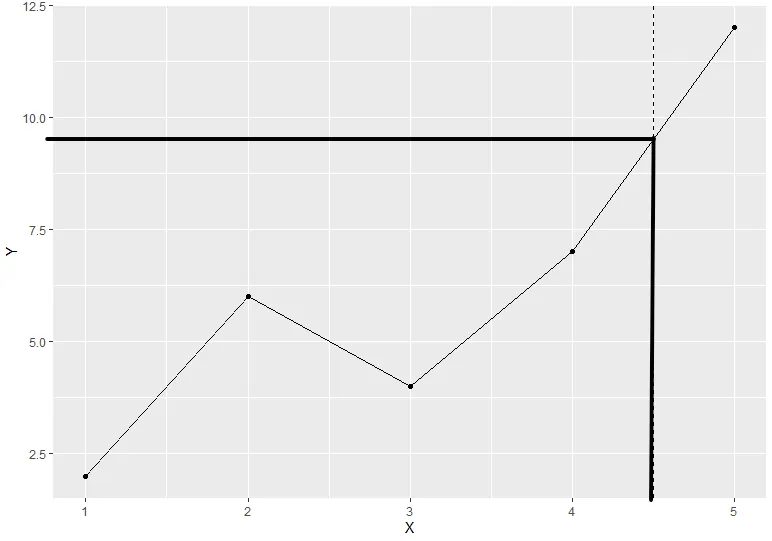
geom_path(data = data.frame(x = c(-Inf, 4.5, 4.5), y = c(approx(X, Y, 4.5)$y, approx(X, Y, 4.5)$y, -Inf)), aes(x, y), color = "red", linetype = 2)
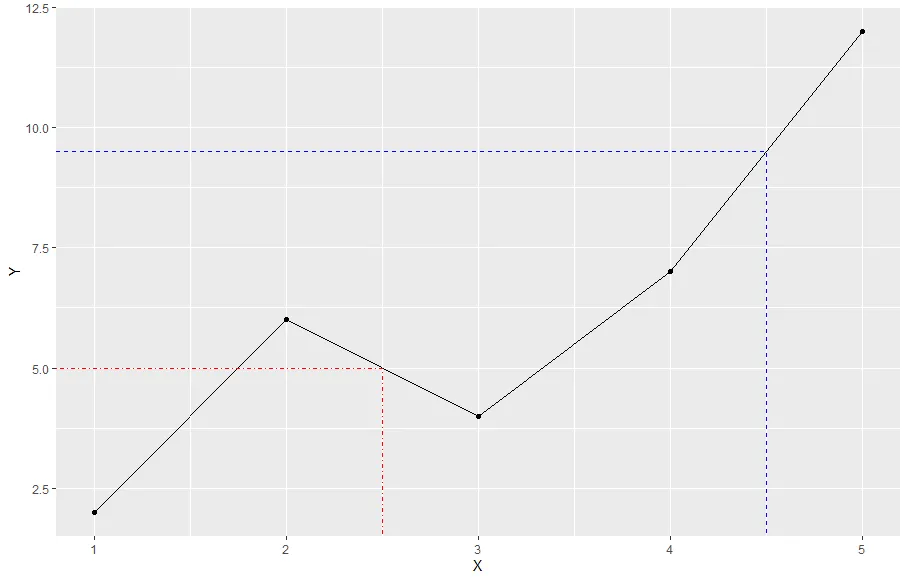
如果您希望更灵活地进行拦截,可以使用此函数。
请注意...
部分,因此您可以将geom_path
参数传递,如颜色、线型、大小等。它支持基于x
值或基于y
值的拦截。my_intercept <- function(x, y, ...) {
if (!missing(x)) dt <- data.frame(x = c(-Inf, x, x), y = c(approx(X, Y, x)$y, approx(X, Y, x)$y, -Inf))
if (!missing(y)) dt <- data.frame(x = c(-Inf, approx(Y, X, y)$y, approx(Y, X, y)$y), y = c(y, y, -Inf))
geom_path(data = dt, aes(x, y), ...)
}
ggplot(data = DF, aes(x = X, y = Y)) +
geom_point() +
geom_line() +
my_intercept(x = 4.5, color = "blue", linetype = 2) +
my_intercept(y = 5, color = "red", linetype = 4)
正如@Eric在他的评论中提到的那样,geom_segment
是实现所需结果的方法。此外,您需要手动计算分段应该穿过geom_line
的y
值,这可以使用approx
来完成。快速处理可能如下所示:
library(ggplot2)
X <- 1:5
Y <- c(2, 6, 4, 7, 12)
DF <- data.frame(X, Y)
# vertical line
vsegment <- function(x, X, Y) {
geom_segment(aes(x = x, xend = x, y = -Inf, yend = approx(X, Y, x)$y),
linetype = 2)
}
# horizontal line
hsegment <- function(x, X, Y) {
geom_segment(aes(x = -Inf, xend = x, y = approx(X, Y, x)$y, yend = approx(X, Y, x)$y),
linetype = 2)
}
ggplot(data = DF,
aes(x = X,
y = Y)) +
geom_point() +
geom_line() +
vsegment(4.5, X, Y) +
hsegment(4.5, X, Y)
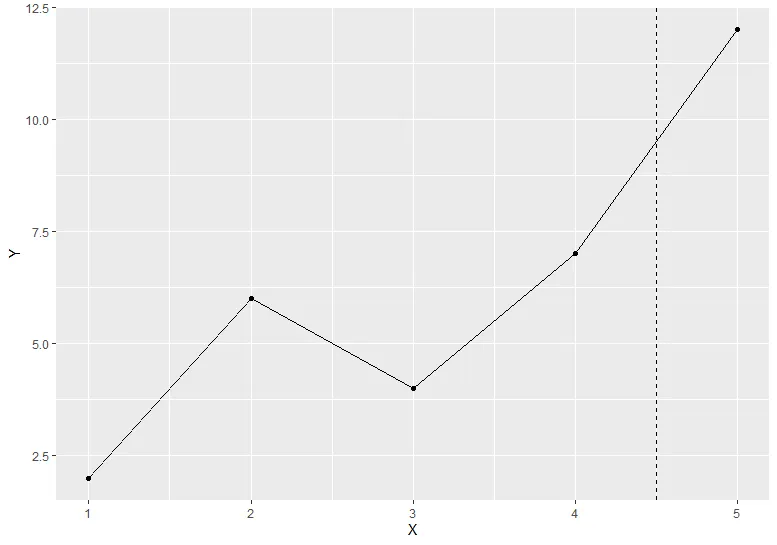
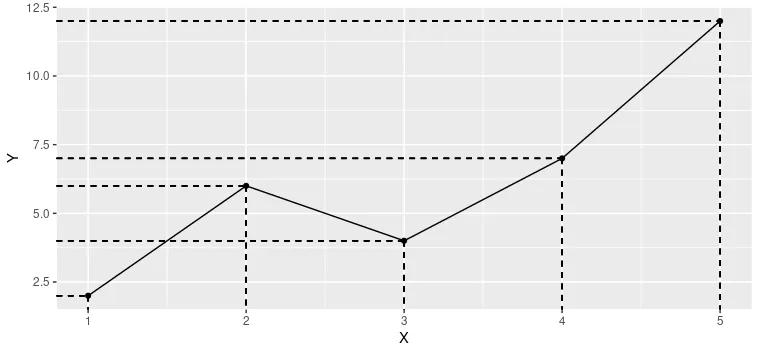
geom_segment(aes(x=X,xend=X,y=0,yend=Y),linetype=2)+ geom_segment(aes(x=0,xend=X,y=Y,yend=Y),linetype=2)
。 - Eric