我创建了一个函数,用于在折线图中绘制每个城市的一些数据。我希望用户能够更改图例中每个城市的标签。
一个简化的示例:
有任何想法为什么保存函数时会表现不同?
一个简化的示例:
example_plot <- function(plot_labs = c("Anvers", "Liège")){

graphics.off()

input <- data.table(x_axis = c(1, 2, 3, 4, 5, 1, 2, 3, 4, 5),
                y_axis = c(5, 6, 4, 2, 8, 9, 3, 1, 7, 5),
                City = c("Anvers", "Anvers", "Anvers", "Anvers", "Anvers",
                         "Liege", "Liege", "Liege", "Liege", "Liege"))

ggplot(data = input, aes(x = x_axis, y = y_axis, group = City, lty = City)) +
geom_line() + scale_linetype_manual(labels = plot_labs, breaks = c("Anvers",
"Liege"), values = 1:2)
}
我的问题:
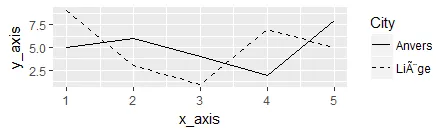
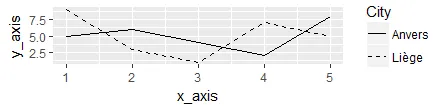
当我把函数保存为“example_plot.R”并在命令提示符中调用它时,"Liège" 中的重音不能正确地显示:
example_plot()
example_plot(plot_labs = c("Anvers", "Liège"))
有任何想法为什么保存函数时会表现不同?