你可以通过修改图形对象的属性(而不是修改函数本身)来改变
boxplot 显示数据/分位数的方式。
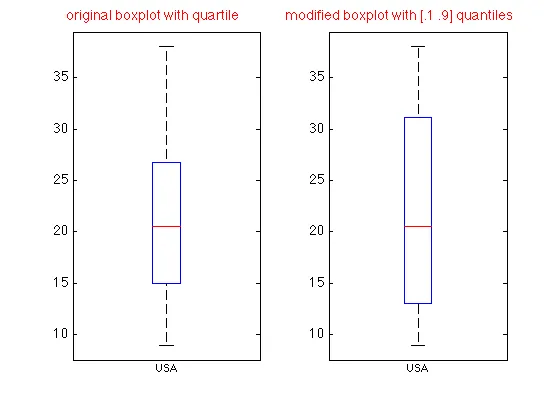
这里有一段代码,它将修改用于蓝色框的分位数(最初,蓝色框对应 .25 和 .75 分位数,将更改为 .1 和 .9)。上/下须的基础部分也会相应更改。请注意,须的尖端没有改变(仍然对应于四分位距的 1.5 倍)。您可以像更改其基础部分一样更改须的尖端。
load carsmall
MPG = MPG(ismember(Origin,'USA','rows'));
Origin = Origin(ismember(Origin,'USA','rows'),:)
Origin(isnan(MPG),:) = [];
MPG (isnan(MPG),:) = [];
q = quantile(MPG,[0.1 0.25 0.75 0.9]);
q10 = q(1);
q25 = q(2);
q75 = q(3);
q90 = q(4);
figure('Color','w');
subplot(1,2,1);
boxplot(MPG,Origin);
title('original boxplot with quartile', 'FontSize', 14, 'FontWeight', 'b', 'Color', 'r');
set(gca, 'FontSize', 14);
subplot(1,2,2);
h = boxplot(MPG,Origin)
title('modified boxplot with [.1 .9] quantiles', 'FontSize', 14, 'FontWeight', 'b', 'Color', 'r');
set(gca, 'FontSize', 14);
set(h(5,1), 'YData', [q10 q90 q90 q10 q10]);
upWhisker = get(h(1,1), 'YData');
set(h(1,1), 'YData', [q90 upWhisker(2)])
dwWhisker = get(h(2,1), 'YData');
set(h(2,1), 'YData', [ dwWhisker(1) q10])
for ii = 1:7
ii
get(h(ii,1))
end
这里是结果。
computeBoxIndices。 - Jonas