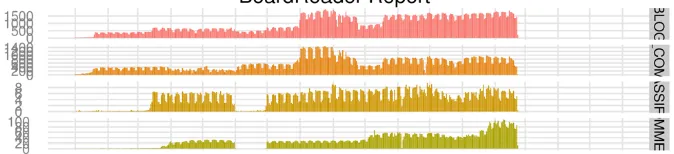
我遇到了一个问题,不知道如何在“x”天内计算平均值。如果我试图在一年内绘制这个csv文件,那么在折线图上正确显示过多的数据(附属屏幕截图)。我想要将数据平均分布在每几天(也许是2天,一周等),以便折线图更容易阅读。有什么建议吗?我应该如何使用R解决这个问题?
results.csv
POSTS,PROVIDER,TYPE,DATE
29337,FTP,BLOG,2010-01-01
26725,FTP,BLOG,2010-01-02
27480,FTP,BLOG,2010-01-03
31187,FTP,BLOG,2010-01-04
31488,FTP,BLOG,2010-01-05
32461,FTP,BLOG,2010-01-06
33675,FTP,BLOG,2010-01-07
38897,FTP,BLOG,2010-01-08
37122,FTP,BLOG,2010-01-09
41365,FTP,BLOG,2010-01-10
51760,FTP,BLOG,2010-01-11
50859,FTP,BLOG,2010-01-12
53765,FTP,BLOG,2010-01-13
56836,FTP,BLOG,2010-01-14
59698,FTP,BLOG,2010-01-15
52095,FTP,BLOG,2010-01-16
57154,FTP,BLOG,2010-01-17
80755,FTP,BLOG,2010-01-18
227464,FTP,BLOG,2010-01-19
394510,FTP,BLOG,2010-01-20
371303,FTP,BLOG,2010-01-21
370450,FTP,BLOG,2010-01-22
268703,FTP,BLOG,2010-01-23
267252,FTP,BLOG,2010-01-24
375712,FTP,BLOG,2010-01-25
381041,FTP,BLOG,2010-01-26
380948,FTP,BLOG,2010-01-27
373140,FTP,BLOG,2010-01-28
361874,FTP,BLOG,2010-01-29
265178,FTP,BLOG,2010-01-30
269929,FTP,BLOG,2010-01-31
R脚本
library(ggplot2);
data <- read.csv("results.csv", header=T);
dts <- as.POSIXct(data$DATE, format="%Y-%m-%d");
attach(data);
a <- ggplot(dataframe, aes(dts,POSTS/1000, fill = TYPE)) + opts(title = "Report") + labs(x = NULL, y = "Posts (k)", fill = NULL);
b <- a + geom_bar(stat = "identity", position = "stack");
plot_theme <- theme_update(axis.text.x = theme_text(angle=90, hjust=1), panel.grid.major = theme_line(colour = "grey90"), panel.grid.minor = theme_blank(), panel.background = theme_blank(), axis.ticks = theme_blank(), legend.position = "none");
c <- b + facet_grid(TYPE ~ ., scale = "free_y");
d <- c + scale_x_datetime(major = "1 months", format = "%Y %b");
ggsave(filename="/root/results.png",height=14,width=14,dpi=600);
图像
geom_smooth而不是geom_bar了吗? - hadley