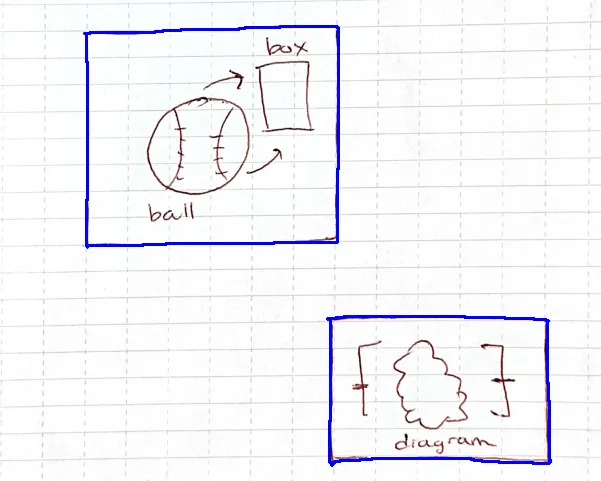
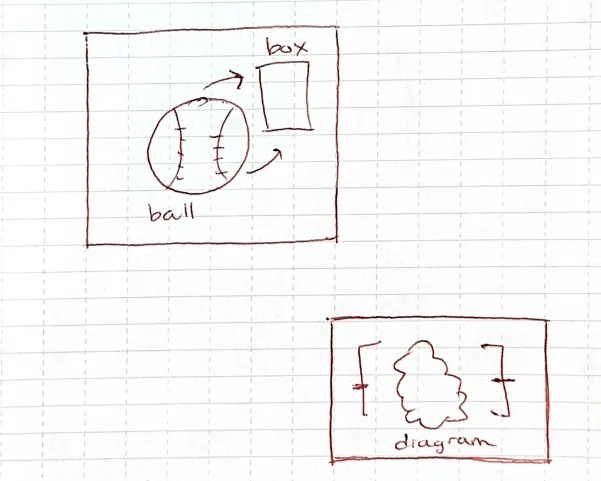
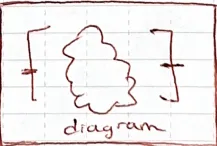
我有以下图片:
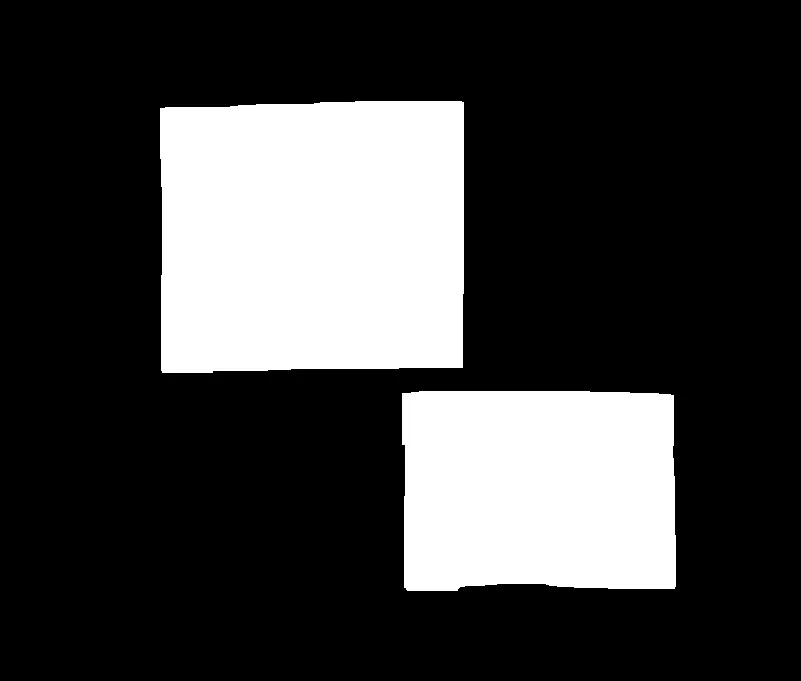
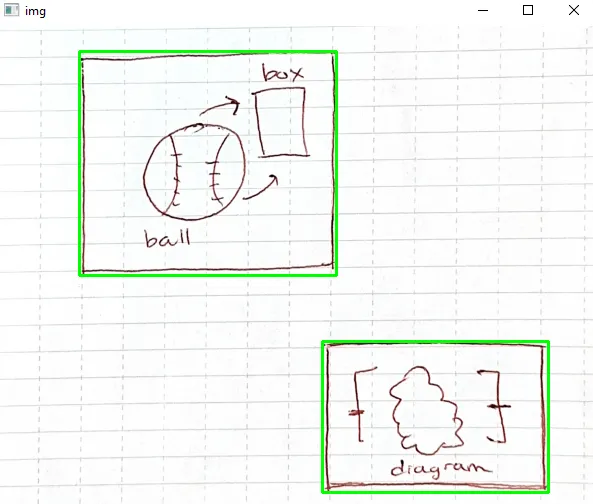
我想要提取出框中的图表,如下所示:
这是我的尝试:
import cv2
import matplotlib.pyplot as plt
# Load the image
image = cv2.imread('diagram.jpg')
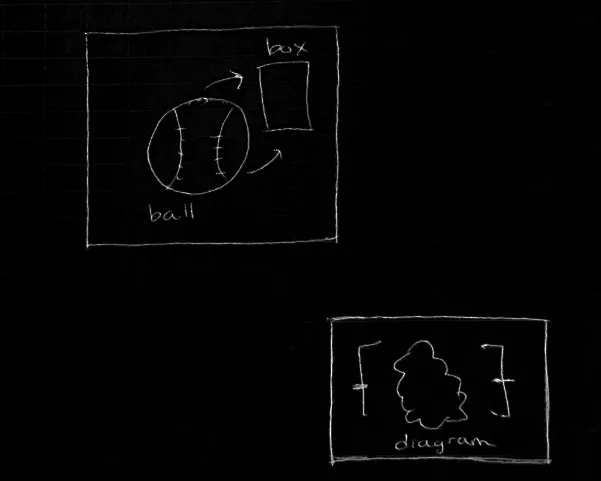
# Convert to grayscale
gray = cv2.cvtColor(image, cv2.COLOR_BGR2GRAY)
# Apply thresholding to create a binary image
_, thresh = cv2.threshold(gray, 127, 255, cv2.THRESH_BINARY_INV)
# Find contours
contours, hierarchy = cv2.findContours(thresh, cv2.RETR_EXTERNAL, cv2.CHAIN_APPROX_SIMPLE)
# Draw the contours
cv2.drawContours(image, contours, -1, (0, 0, 255), 2)
# Show the final image
plt.imshow(image), plt.show()
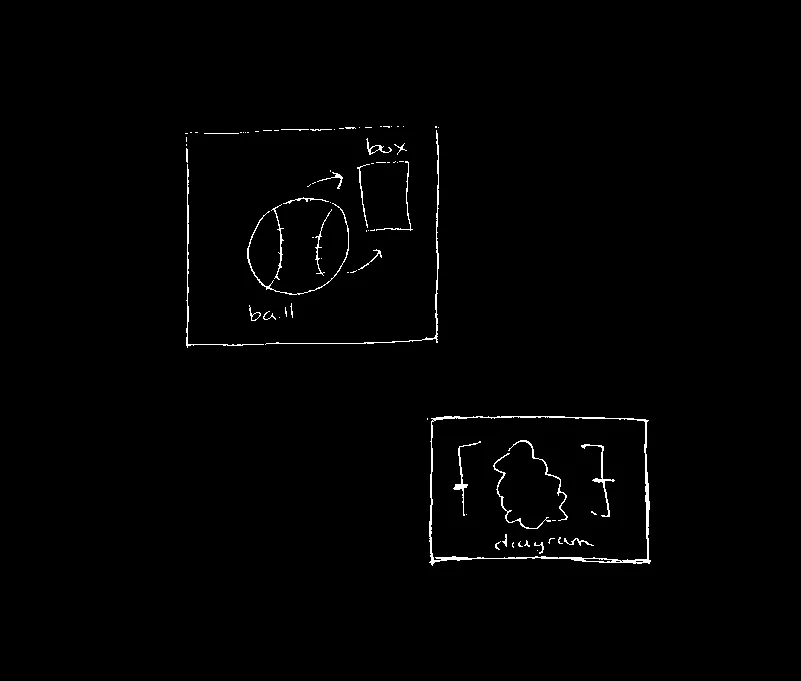
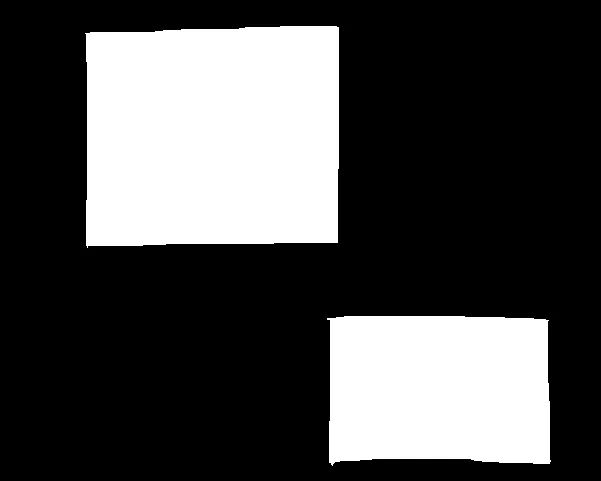
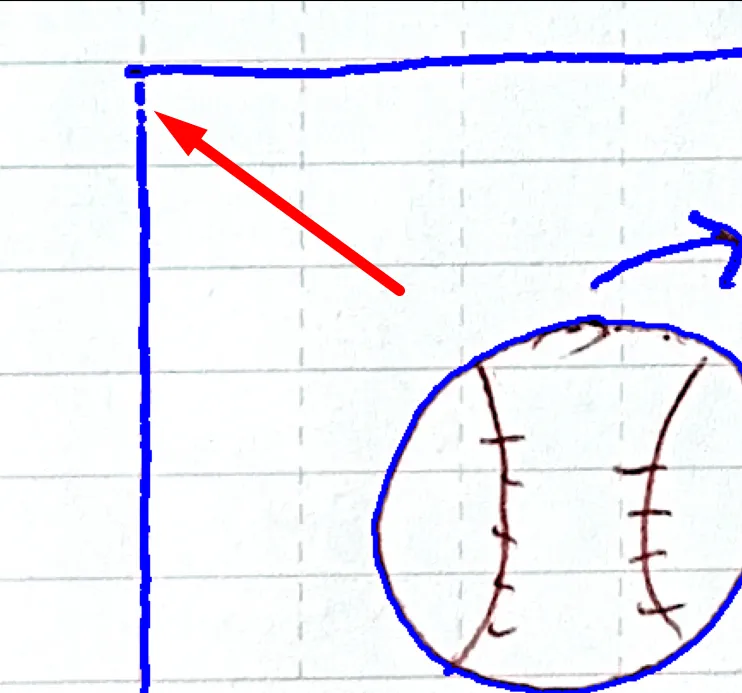
然而,我意识到由于轮廓不封闭,提取图表将会很困难:
# Define a rectangular kernel for morphological closing
kernel = cv2.getStructuringElement(cv2.MORPH_RECT, (5, 5))

# Perform morphological closing to close the gaps in the box edges
closed = cv2.morphologyEx(thresh, cv2.MORPH_CLOSE, kernel)
但这几乎没有改变什么。我该如何解决这个问题?