在执行t-SNE降维后,使用k-means算法并检查每个簇中哪些特征对其贡献最大。

4
以下图表显示了t-SNE图。我可以在这里展示它,但不幸的是,我无法向您展示标签。有4个不同的标签:

enter image description here

该图使用名为
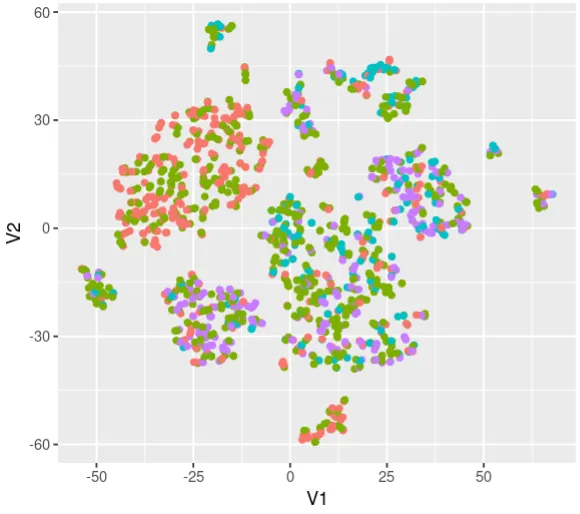
scores的数据框创建,其中包含约1100个患者样本和25个特征,由其列表示。图的标签来自一个名为metadata的单独数据框。以下代码用于生成图,利用了scoresmetadata数据框中的信息。
tsneres <- Rtsne(scores, dims = 2, perplexity = 6)
tsneres$Y = as.data.frame(tsneres$Y)
ggplot(tsneres$Y, aes(x = V1, y = V2, color = metadata$labels)) + 
  geom_point()

我的任务:

我想要分析t-SNE图并确定哪些特征或“scores”矩阵中的列在每个聚类中最为普遍。具体来说,我想要了解哪些特征对于区分图中不同聚类最有帮助。是否可以使用另一种算法,例如保留数据点之间距离的PCA算法来完成此任务?也许这比t-SNE更好?

这是一个示例,这不是真实数据,但它很相似:

structure(list(Feature1 = c(0.1, 0.3, -0.2, -0.12, 0.17, -0.4, 
-0.21, -0.19, -0.69, 0.69), Feature2 = c(0.22, 0.42, 0.1, -0.83, 
0.75, -0.34, -0.25, -0.78, -0.68, 0.55), Feature3 = c(0.73, -0.2, 
0.8, -0.48, 0.56, -0.21, -0.26, -0.78, -0.67, 0.4), Feature4 = c(0.34, 
0.5, 0.9, -0.27, 0.64, -0.11, -0.41, -0.82, -0.4, -0.23), Feature5 = c(0.45, 
0.33, 0.9, 0.73, 0.65, -0.1, -0.28, -0.78, -0.633, 0.32)), class = "data.frame", row.names = c("Patient_A", 
"Patient_B", "Patient_C", "Patient_D", "Patient_E", "Patient_F", 
"Patient_G", "Patient_H", "Patient_I", "Patient_J"))

编辑 - PYTHON

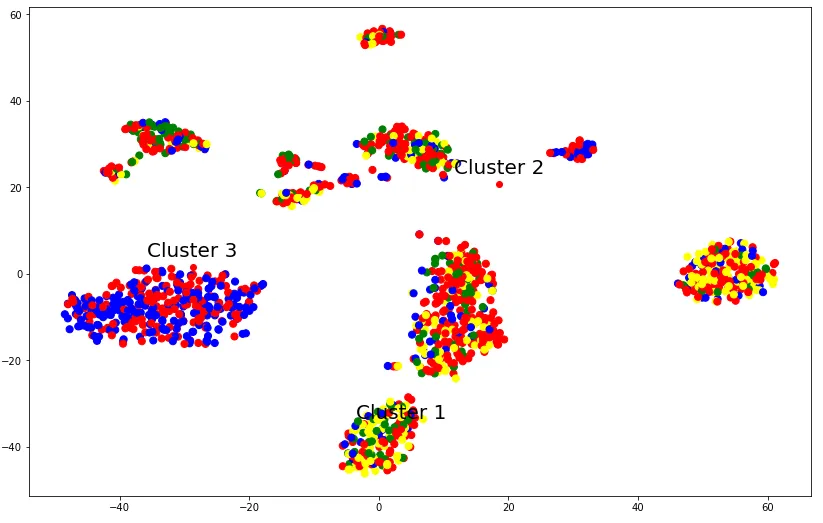
我在Python中达到了相同的程度。我最初尝试了PCA,但它产生了非常糟糕的图形。因此,我首先使用t-SNE降低了维度,这产生了更好的结果,并使用k-means聚类数据。我仍然像以前一样有同样的问题,只是现在我不介意使用R或Python。

这是新图:

enter image description here

这是代码:

from sklearn.manifold import TSNE
tsne = TSNE(n_components=2, perplexity=30, learning_rate=200)
tsne_result = tsne.fit_transform(scores)

#create a dict to map the labels to colors
label_color_dict = {'label1':'blue', 'label2':'red', 'label3':'yellow', 'label4':'green'}

#create a list of colors based on the 'labels' column in metadata
colors = [label_color_dict[label] for label in metadata[['labels']]

plt.scatter(tsne_result[:, 0], tsne_result[:, 1], c=colors, s=50)
plt.scatter(cluster_centers[:, 0], cluster_centers[:, 1], c='red', marker='o')

# Add labels to the cluster centers
for i, center in enumerate(cluster_centers,1):
    plt.annotate(f"Cluster {i}", (center[0], center[1]), 
                 textcoords="offset points", 
                 xytext=(0,10), ha='center', fontsize=20)

如果你想保留距离,我会说最好的选择是多维缩放:https://en.wikipedia.org/wiki/Multidimensional_scaling - mastropi
@mastropi 我不确定我需要它...我的主要问题是如何确定 t-SNE 图中每个聚类中最常见的列。 - Programming Noob
是的,我理解了你的意思。我只是想指出,与其使用PCA,我认为多维缩放更适合保留距离(即我只是在评论你的句子“是否可以使用其他算法,如PCA,来保留数据点之间的距离...?”)。 除此之外,我现在无法帮助你回答这个问题,因为我没有时间进一步调查。但是,毫无疑问,你的问题非常有趣! :-) - mastropi
1
正如你的要求:我不建议你使用t-SNE进行特征分析。tSNE对于可视化和揭示数据中存在的模式和集群非常棒。但是,tSNE存在一些问题:它受到随机性、其他超参数设置和数据缩放的影响。根据perplexity的不同,集群可能会分裂或形成。目标是找到一个嵌入,使得相似的值彼此靠近,相反较远的点并不一定非常不相似,这意味着嵌入中的距离不是一个好的指标,也无法将其反转回原始空间和特征。 - Daraan
你所说的“聚类”指的是你提到的4个标签还是t-SNE图中的点组? - m13op22
2个回答

1
TSNE是一种很好的可视化方式,但不适合获取降维特征空间。即使您能够有效地进行降维(例如使用n=3的PCA),并且能够获得新的特征F1、F2和F3:也不容易找到哪些原始特征有助于区分不同的聚类。
您好,我同意@MotaBtw的观点,Silhouette是衡量特征重要性的好方法。但我将尝试根据您的用例来解释同样的内容。 按照定义,Silhouette分数将通过计算平均簇内距离和平均簇间距离之间的差异来评估聚类运行。这种差异越大,聚类运行就越好。 请参见此详细图像 我们可以稍微不同地使用相同的逻辑,其中我们想要找到每个特征对轮廓分数的贡献。贡献越大的特征越重要。
已创建一个工作算法,并将代码添加到github存储库中,因为在此处添加有点冗长: https://github.com/vsablok123/silhouette_feature_importance/
def silhouette_feature_importance(X, labels):
"""
The Silhouette Coefficient is calculated using the mean intra-cluster
distance (a) and the mean nearest-cluster distance (b) for each sample.
The Silhouette Coefficient for a sample is ``(b - a) / max(a, b)``.
To clarrify, b is the distance between a sample and the nearest cluster
that b is not a part of.
The feature importance is inferred by looking at the features which contribute the most
to the silhouette coefficient.
Parameters
----------
X : array [n_samples_a, n_features]
    Feature array.
labels : array, shape = [n_samples]
         label values for each sample
Returns
-------
silhouette : array, shape = [n_features]
    Feature importance for each feature

"""
n = labels.shape[0]
A = np.array([_intra_cluster_distance(X, labels,i)
              for i in range(n)])
B = np.array([_nearest_cluster_distance(X, labels, i)
              for i in range(n)])
print(f"A shape = {A.shape}")
print(f"B shape = {B.shape}")
sil_samples = abs(B - A)
# nan values are for clusters of size 1, and should be 0
return np.mean(np.nan_to_num(sil_samples), axis=0)

以下是针对您的应用案例需要采取的步骤:

  1. 在对“分数”进行聚类之前,找到高度相关的特征并将其删除。
  2. 使用任何算法运行聚类,但聚类应该是经过优化的。例如,在Kmeans情况下,我们应使用肘部方法找到理想的n_clusters。
  3. 现在,将聚类输出传递给silhouette_feature_importance算法以获取前几个重要特征。

如果有理解代码的问题,请告诉我。


0

只是提供一些思路:您可以将t-SNE维度聚类成已知的簇(例如5个簇)。然后,将该信息合并到包含原始变量的原始数据框中,并尝试训练一个简单的分类算法(例如catboost,以保持简单和性能良好)。分类算法的目标是预测簇。

最后,您可以使用可解释的AI方法,如shapley valuesanchors来解释模型的决策。

假设您的模型达到了合理的性能水平,它将为您提供与特定簇相关的驱动程序列表。

如果您需要代码方面的帮助,请告诉我。希望这有所帮助。


网页内容由stack overflow 提供, 点击上面的
可以查看英文原文,
原文链接