我找不到使用Vega制作的状态/类/流程/组织图表的示例。有吗?
感觉Vega非常适合这个(虽然有点过于强大),但是没有起点示例,学习曲线相当陡峭。"How Vega Works"页面上有一些示例,但没有链接说明如何构建它们。
还有一个树形布局的例子,但是不清楚如何开始将其转换为适合流程图样式的块。
我找不到使用Vega制作的状态/类/流程/组织图表的示例。有吗?
感觉Vega非常适合这个(虽然有点过于强大),但是没有起点示例,学习曲线相当陡峭。"How Vega Works"页面上有一些示例,但没有链接说明如何构建它们。
还有一个树形布局的例子,但是不清楚如何开始将其转换为适合流程图样式的块。
"values": [
        {"id": "1", "parent": null, "title": "Animal"},
        {"id": "2", "parent": "1", "title": "Duck"},
        {"id": "3", "parent": "1", "title": "Fish"},
        {"id": "4", "parent": "1", "title": "Zebra"}
      ]
stratify 可以完成此任务):"transform": [
{
"type": "stratify",
"key": "id",
"parentKey": "parent"
},
{
"type": "tree",
"method": "tidy",
"separation": true,
"size": [{"signal": "width"}, {"signal": "height"}]
}
]
在摆放节点之后,您需要生成连接线条,treelinks + linkpath 组合正是这样做的:
{
"name": "links",
"source": "tree", // take datasource "tree" as input
"transform": [
{ "type": "treelinks" }, // apply transform 1
{ "type": "linkpath", // follow up with next transform
"shape": "diagonal"
}
]
}
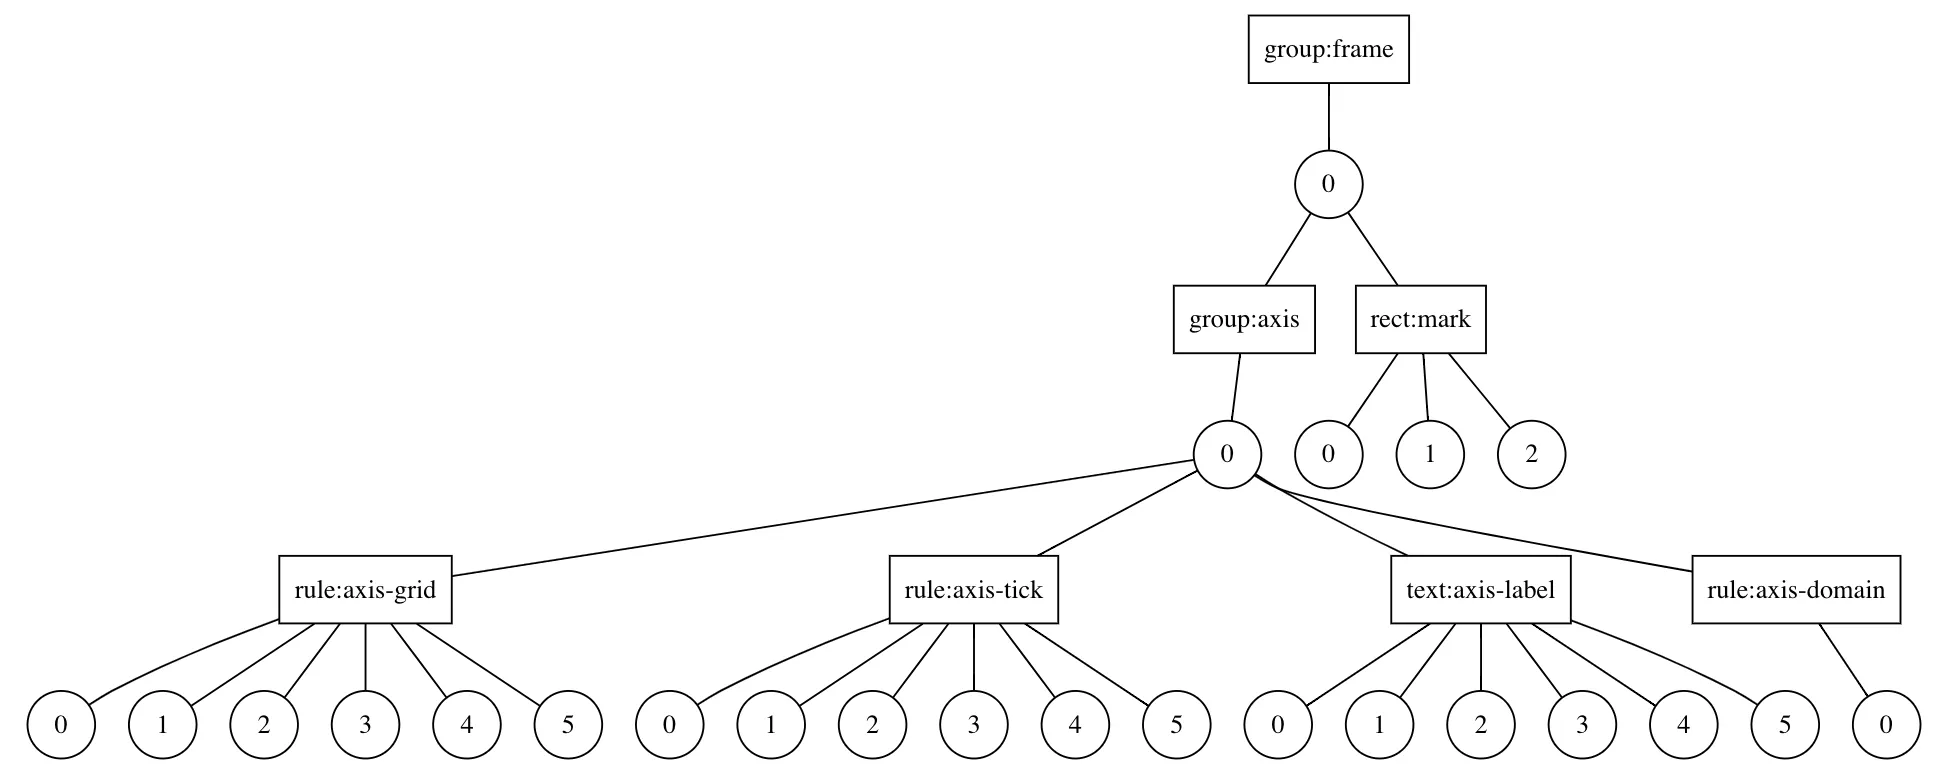
现在你已经拥有了数据源,想要绘制实际的对象。在 Vega 中,这些被称为 marks。我猜这就是我要偏离你所期望的输出的地方,因为我只会为每个数据点绘制一个带标题的矩形和一些基本线条进行连接:
"marks": [
{
"type": "path",
"from": {"data": "links"}, // dataset we defined above
"encode": {
"enter": {
"path": {"field": "path"} // linkpath generated a dataset with "path" field in it - we just grab it here
}
}
},
{
"type": "rect",
"from": {"data": "tree"},
"encode": {
"enter": {
"stroke": {"value": "black"},
"width": {"value": 100},
"height": {"value": 20},
"x": {"field": "x"},
"y": {"field": "y"}
}
}
},
{
"type": "text",
"from": {"data": "tree"}, // use data set we defined earlier
"encode": {
"enter": {
"stroke": {"value": "black"},
"text": {"field": "title"}, // we can use data fields to display actual values
"x": {"field": "x"}, // use data fields to draw values from
"y": {"field": "y"},
"dx": {"value":50}, // offset the mark to appear in rectangle center
"dy": {"value":13},
"align": {"value": "center"}
}
}
}
]
总的来说,我已经得出了一个非常基本的近似你的目标状态。这绝对不是一个精确的匹配:那里的矩形应该用组替换,并且连接路径也需要一些工作。您会注意到我没有使用任何信号来提供动态用户输入和更新/退出/悬停指令 - 再次因为简单。
{
"$schema": "https://vega.github.io/schema/vega/v5.json",
"width": 800,
"height": 300,
"padding": 5,
"data": [
{
"name": "tree",
"values": [
{"id": "1", "parent": null, "title": "Animal"},
{"id": "2", "parent": "1", "title": "Duck"},
{"id": "3", "parent": "1", "title": "Fish"},
{"id": "4", "parent": "1", "title": "Zebra"}
],
"transform": [
        {
          "type": "stratify",
          "key": "id",
          "parentKey": "parent"
        },
        {
          "type": "tree",
          "method": "tidy",
          "separation": true,
          "size": [{"signal": "width"}, {"signal": "height"}]
        }
      ]
},
{
"name": "links",
"source": "tree",
"transform": [
{ "type": "treelinks" },
{ "type": "linkpath",
"shape": "diagonal"
}
]
},
{
"name": "tree-boxes",
"source": "tree",
"transform": [
{
"type": "filter",
"expr": "datum.parent == null"
}
]
},
{
"name": "tree-circles",
"source": "tree",
"transform": [
{
"type": "filter",
"expr": "datum.parent != null"
}
]
}
],
"marks": [
{
"type": "path",
"from": {"data": "links"},
"encode": {
"enter": {
"path": {"field": "path"}
}
}
},
{
      "type": "rect",
      "from": {"data": "tree-boxes"},
      "encode": {
        "enter": {
          "stroke": {"value": "black"},
          "width": {"value": 100},
          "height": {"value": 20},
          "x": {"field": "x"},
          "y": {"field": "y"}
        }
      }
    },
    {
      "type": "symbol",
      "from": {"data": "tree-circles"},
      "encode": {
        "enter": {
          "stroke": {"value": "black"},
          "width": {"value": 100},
          "height": {"value": 20},
          "x": {"field": "x"},
          "y": {"field": "y"}
        }
      }
},
{
"type": "rect",
"from": {"data": "tree"},
"encode": {
"enter": {
"stroke": {"value": "black"},
"width": {"value": 100},
"height": {"value": 20},
"x": {"field": "x"},
"y": {"field": "y"}
}
}
},
{
"type": "text",
"from": {"data": "tree"},
"encode": {
"enter": {
"stroke": {"value": "black"},
"text": {"field": "title"},
"x": {"field": "x"},
"y": {"field": "y"},
"dx": {"value":50},
"dy": {"value":13},
"align": {"value": "center"}
}
}
}
]
}
tree数据集上添加两个基于filter转换,并相应地对它们进行过滤: {
"name": "tree-boxes",
"source": "tree", // grab the existing data
"transform": [
{
"type": "filter",
"expr": "datum.parent == null" // run it through a filter defined by expression
}
]
},
{
"name": "tree-circles",
"source": "tree",
"transform": [
{
"type": "filter",
"expr": "datum.parent != null"
}
]
}
那么,与其将所有标记渲染为 rect,您需要为各自转换的数据集使用两种不同的形状:
{
"type": "rect",
"from": {"data": "tree-boxes"},
"encode": {
"enter": {
"stroke": {"value": "black"},
"width": {"value": 100},
"height": {"value": 20},
"x": {"field": "x"},
"y": {"field": "y"}
}
}
},
{
"type": "symbol",
"from": {"data": "tree-circles"},
"encode": {
"enter": {
"stroke": {"value": "black"},
"width": {"value": 100},
"height": {"value": 20},
"x": {"field": "x"},
"y": {"field": "y"}
}
}
}
我已经建立了一个示例,它是迄今为止最接近本问题所描述的内容。我的解决方案基于这里被接受的答案,感谢@timur。
Click here to view it in the Vega Editor.
它将树节点显示为具有多个文本的组。它支持展开和折叠节点以及在水平和垂直布局之间切换(您可以通过设置horizontal信号的默认值来控制)。然而,我遇到了一些限制:
无论如何,对于任何寻找使用Vega构建组织图表类可视化的人来说,这都应该是有用的 - 没有更接近的示例,我不得不花费很多时间来弄清楚所有注意事项并解决几乎所有问题。