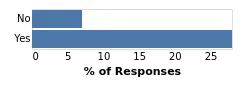
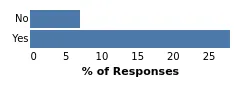
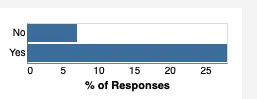
我想从下面的 Vega-lite 图表中删除/隐藏坐标轴线。 我已尝试将颜色更改为 null(如下所示)或其他颜色,但都不起作用。
请参见 https://vega.github.io/editor/#/gist/fc799bc9f7a8f28b8f1f2ec84673e965/VL 有坐标轴线的json文件。
请参见 https://vega.github.io/editor/#/gist/fc799bc9f7a8f28b8f1f2ec84673e965/VL 有坐标轴线的json文件。
{
  "$schema": "https://vega.github.io/schema/vega-lite/v5.json",
  "description": "A simple bar chart with embedded data.",
  "data": {
    "values": [
      {"responseType": "Yes", "proportion": 28},
      {"responseType": "No", "proportion": 7}
    ]
  },
  "mark": "bar",
  "encoding": {
    "y": {
      "field": "responseType",
      "type": "nominal",
      "title": null,
      "axis": {"axisColor": null, "grid": false, "ticks": false}
    },
    "x": {
      "field": "proportion",
      "type": "quantitative",
      "title": "% of Responses",
      "axis": {"axisWidth": "100", "grid": false, "ticks": false}
    }
  }
}