我有一个使用字符串作为索引的pandas dataframe。当我的数据框索引是对象类型时,我如何设置x轴的xlim?我尝试在末尾添加两年,在开头添加一年,其中所有数据集都是np.nan,但这并没有起作用。
以下是数据框: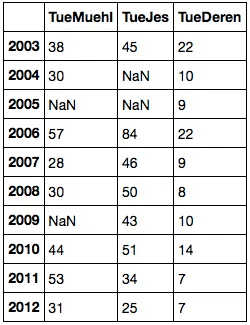 索引的数据类型是object。
以下是数据框:
索引的数据类型是object。df.index
Out[52]: Index(['2003', '2004', '2005', '2006', '2007', '2008', '2009', '2010', '2011', '2012'], dtype='object')
这是一个图表:
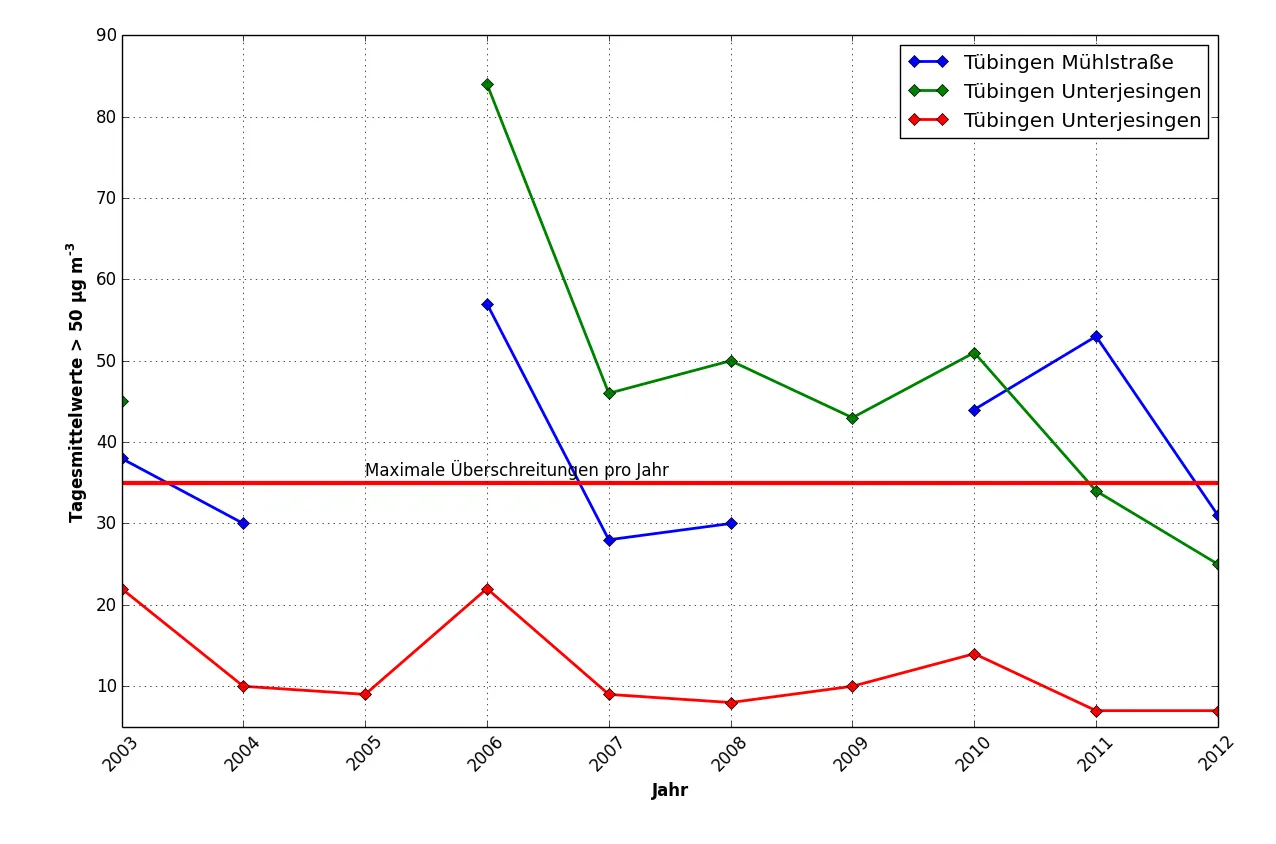
我希望在x轴上有一些额外的空间,以便更好地显示第一年和最后一年的值。我该怎么做?
编辑:
这是一个使用对象而不是日期对象作为索引的最小示例:
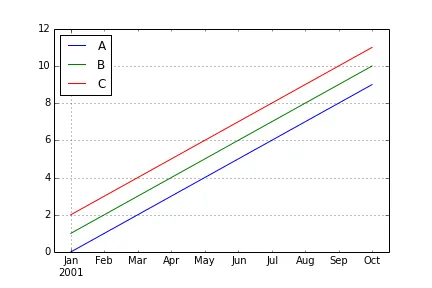
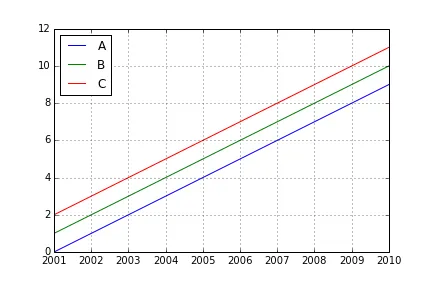
pandas只是过于聪明,重新标记了您的刻度标记。 - tacaswellpandas正在使用FixedFormatter,所以当您更改 xlimit 时,它会更改刻度线的位置/数量,但FixedFormatter的工作方式是第一个刻度线获取第一个字符串,第二个获取第二个,以此类推。 - tacaswell