如何绘制一组点以及LINESTRING?

3
你好,有没有一种方法可以绘制一个LINESTRING列表和一个点列表?
例如,我有:
line_string = [LINESTRING (-1.15.12 9.9, -1.15.13 9.93), LINESTRING (-2.15.12 8.9, -2.15.13 8.93)]
point = [POINT (5.41 3.9), POINT (6.41 2.9)]

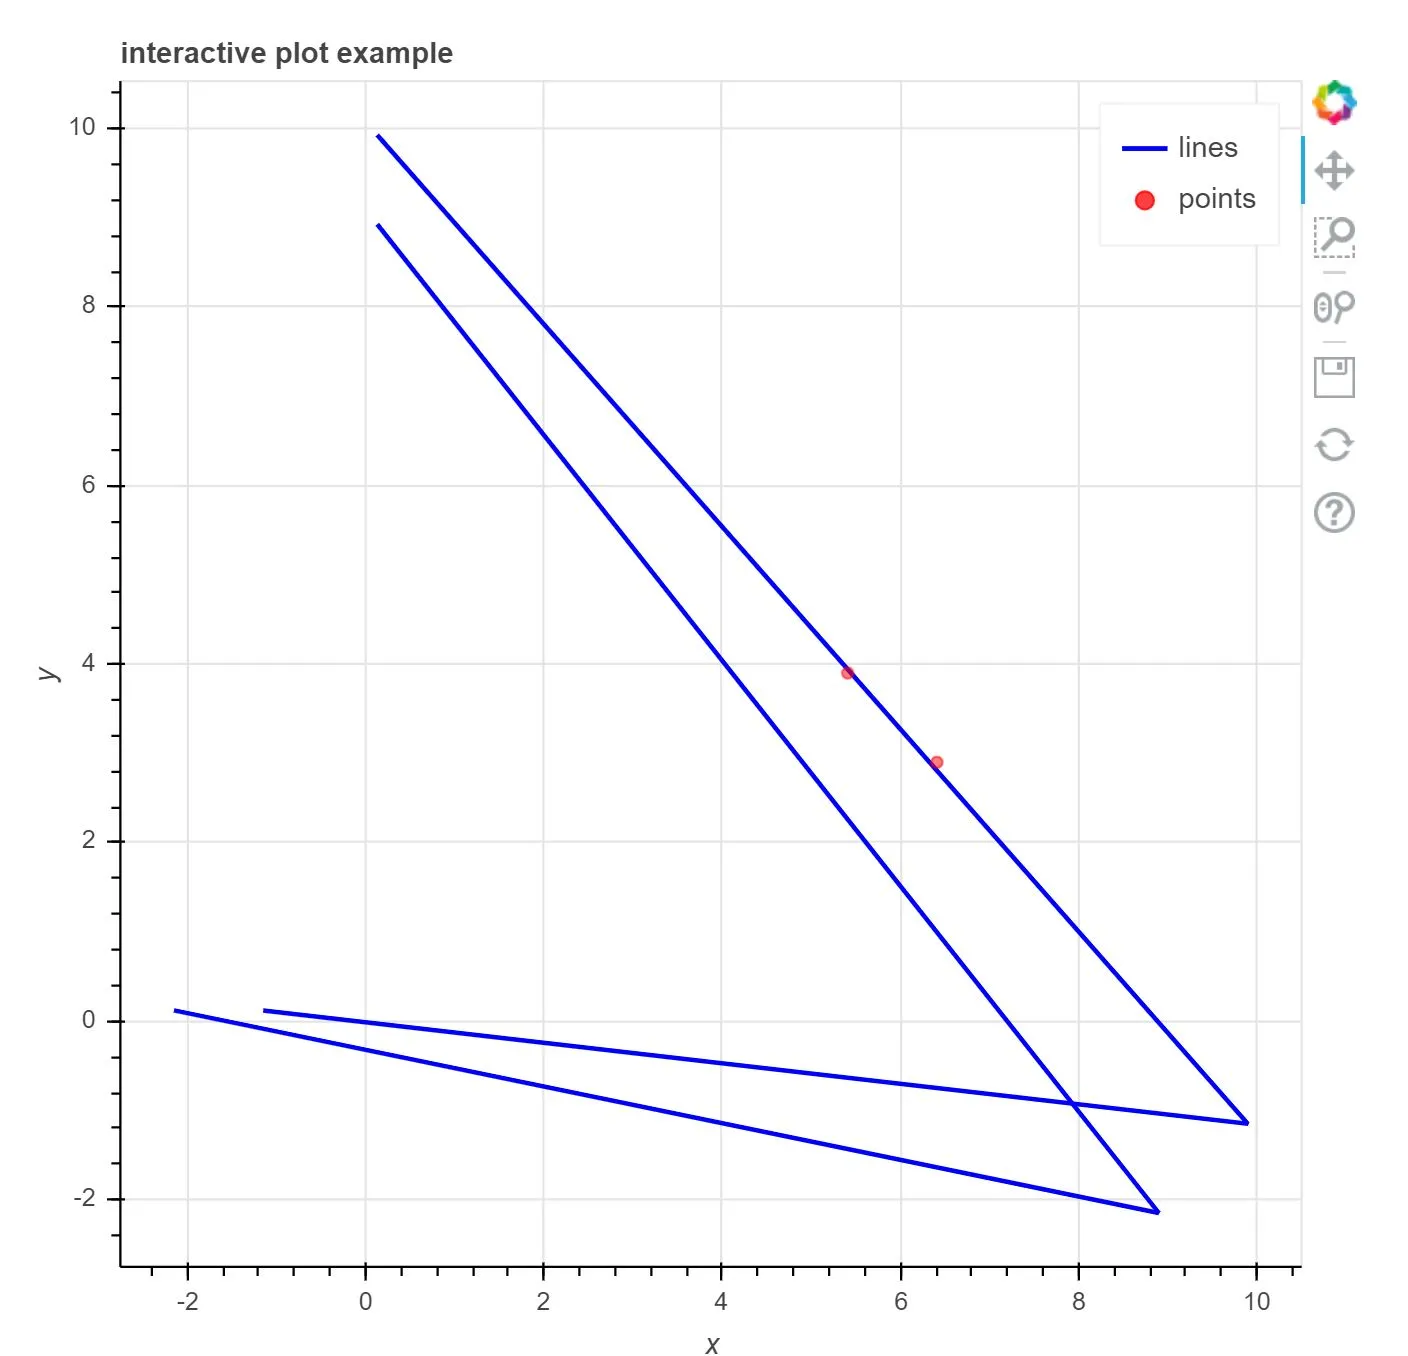
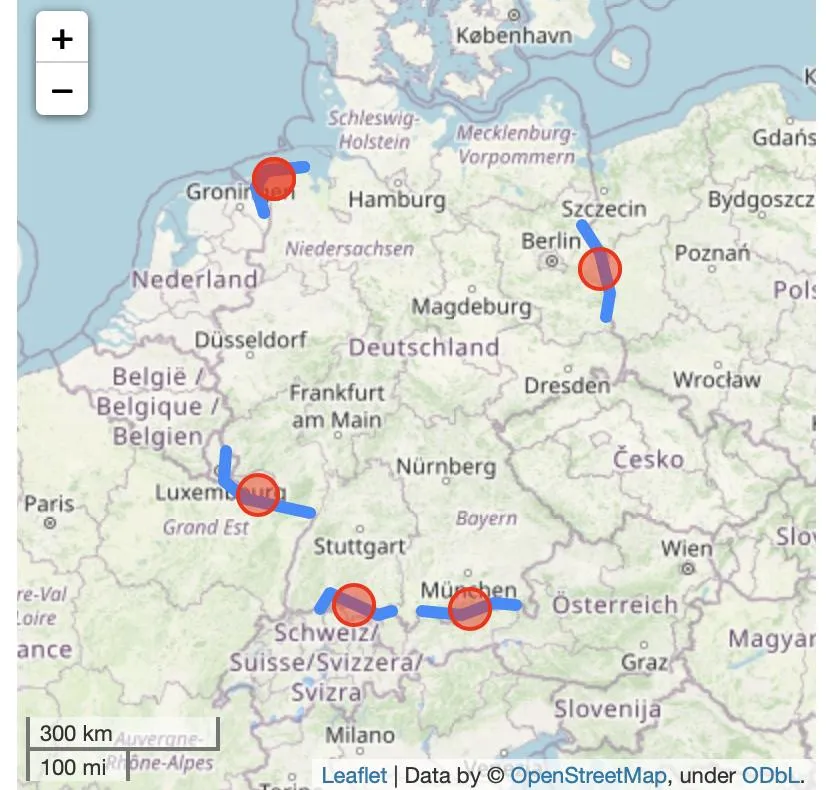
我的目标是拥有一张地图或者图表,它可以显示出点与LINESTRING相连的位置。
预先感谢您。
编辑:
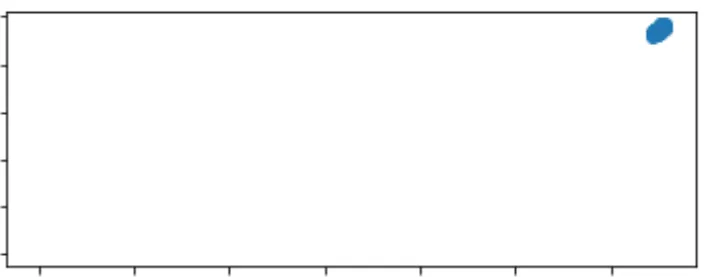
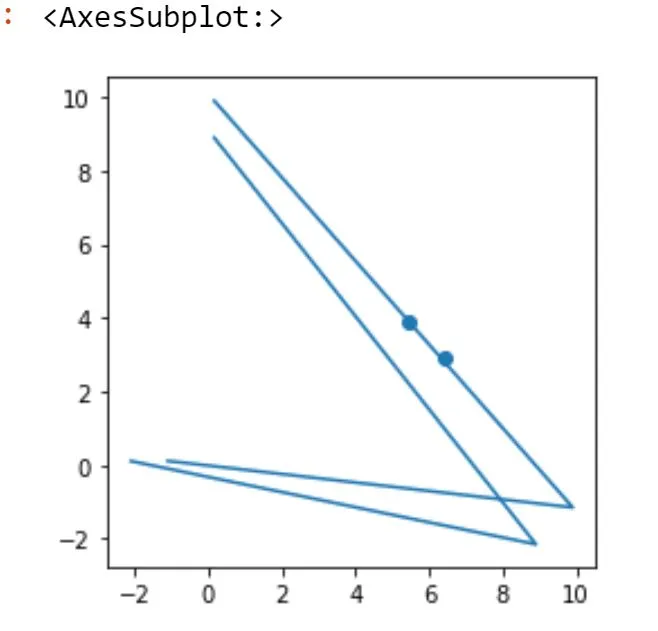
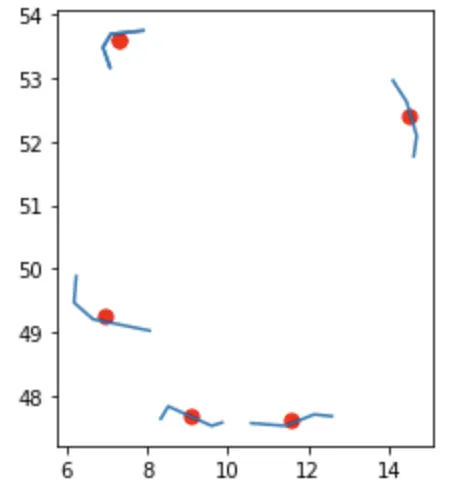
感谢大家的回答,但遗憾的是当我绘制时看起来像这样。我认为问题在于某些LINESTRINGS有4个点(LINESTRING(-1.15.12 9.9,-1.15.13 9.93,-5.15.13 5.53,-3.15.13 2.23)),而有些则只有3个点。是否有更好的方法来绘制这些?

enter image description here


2
只是想要一系列线条和一些点的图形吗?还是希望它们以某种方式相互连接?请澄清。 - Lone Survivr
1
绘制点和线。这将帮助我看到点连接到线的位置。希望这有所帮助。 - helpme
3个回答

6

您可以使用geopandas脚本层轻松地访问matplotlib。

from shapely.geometry import LineString, Point
import geopandas as gpd    

line_strings = [LineString([(-1.15, 0.12), (9.9, -1.15), (0.13, 9.93)]),
                    LineString([(-2.15, 0.12), (8.9, -2.15), (0.13 , 8.93)])]
points = [Point(5.41, 3.9), Point (6.41, 2.9)]

geom = line_strings + points
gdf = gpd.GeoDataFrame(geometry=geom)

gdf.plot()

根据你的评论,你可以使用Bokeh制作交互式图表,如果你想要缩放到特定区域。

from bokeh.plotting import figure, show

p = figure(title="interactive plot example", x_axis_label='x', y_axis_label='y')

for ls in line_strings:

    x, y = ls.coords.xy
    p.line(x, y, legend_label="lines", color="blue", line_width=2)
    

for point in points:
    
    p.circle(point.x, point.y, legend_label="points", size=5, color="red", alpha=0.5)
    

show(p)

matplotlib sample

bokeh sample


1
非常感谢,但是它并不像我预期的那样好看。我添加并更新了编辑以提供更多背景信息。 - helpme

2
  • 您可以将其作为图层绘制
  • 已在 matplotlibfolium 中演示
  • 您的一些几何图形无效
import shapely.wkt
import geopandas as gpd
import pandas as pd

# line_string = ["LINESTRING (-1.15.12 9.9, -1.15.13 9.93)", "LINESTRING (-2.15.12 8.9, -2.15.13 8.93)"]
# invalid geometry - modified
line_string = ["LINESTRING (-1.15 9.9, -1.15 9.93)", "LINESTRING (-2.15 8.9, -2.15 8.93)"]
point = ["POINT (5.41 3.9)", "POINT (6.41 2.9)"]

gs_ls = gpd.GeoSeries(pd.Series(line_string).apply(shapely.wkt.loads))
gs_p = gpd.GeoSeries(pd.Series(point).apply(shapely.wkt.loads))

# matplotlib
ax = gs_ls.plot()
ax = gs_p.plot(ax=ax)

# folium
m = gs_ls.explore()
m = gs_p.explore(m=m)
m

使用替代几何形状

  • 从外观上看,几何形状显然很重要。
  • 已经创建了6个线串作为德国边界的一部分(4个点)。然后将这些线串的中心点分别作为点。
  • 只需要4个点就可以很好地绘制。不需要更长的线串。
import geopandas as gpd
import shapely.geometry
import numpy as np

world = gpd.read_file(gpd.datasets.get_path("naturalearth_lowres"))

# exteriod of germany
ls = world.loc[world["iso_a3"].isin(["DEU"])].exterior.values[0]

# generate a series of linestring segments from germany bounday
gs_l = gpd.GeoSeries(
    [
        shapely.geometry.LineString(list(ls.coords)[s : s + 4])
        for s in np.random.randint(0, len(list(ls.coords)) - 4, 6)
    ], crs="epsg:4326"
)

# folium
m = gs_l.explore(style_kwds={"weight":6}, height=400, width=400)
gs_l.centroid.explore(m=m, color="red", marker_kwds={"radius":10})

# matplotlib
ax = gs_l.plot()
ax = gs_l.centroid.plot(color="red", markersize=50, ax=ax)

m

enter image description here enter image description here


1
非常感谢,但很遗憾它看起来并不像我预期的那样好。我添加并更新了编辑以提供更多上下文。 - helpme
1
更新的答案-在线字符串中的4个点是可以的。关键在于线串和点所代表的内容。 - Rob Raymond
1
谢谢。有没有一种方法可以为LINESTRING和点命名?另外,您是如何将地图与其叠加的?看起来非常酷和有用。 - helpme
1
m = gpd.GeoDataFrame(geometry=gs_l).assign(a="hello").explore(style_kwds={"weight":6}, height=400, width=400) 会添加一个列a,该列将出现在悬停文本中(注意从geoseries更改为geodataframe)。如果定义CRS,则folium将包括基本地图。因此需要使用 crs="epsg:4326" - Rob Raymond
1
最后,有没有办法使LINESTRING变成不同的颜色? - helpme
显示剩余3条评论

1
我创建了一个库,提供了一种非常简单的方法来绘制众所周知的文本字符串和Shapely对象。这个库叫做WKTPlot,它包装了Bokeh库,自动化了@matthew-borish在他们的解决方案中提到的很多内容。使用WKTPlot,这个解决方案看起来会是这样的:
from shapely.geometry import LineString, Point
from wktplot import WKTPlot

line_strings = [
    LineString([(-1.15, 0.12), (9.9, -1.15), (0.13, 9.93)]),
    LineString([(-2.15, 0.12), (8.9, -2.15), (0.13 , 8.93)]),
]
points = [Point(5.41, 3.9), Point (6.41, 2.9)]

// Create plot object
plot = WKTPlot("test1", save_dir=".")

# Add shapes using Bokeh styling arguments
# - https://docs.bokeh.org/en/latest/docs/user_guide/styling.html
for line_string in line_strings:
    plot.add_shape(line_string, line_width=3)

for point in points:
    plot.add_shape(point, line_width=7)

# Save plot to disk [./test1.html]
plot.save()

网页内容由stack overflow 提供, 点击上面的
可以查看英文原文,
原文链接