我正在尝试调整R Markdown文档中的饼图,使其跨越整个页面宽度,或者至少足够宽以适应所有标签。
我已经尝试了一切 - 调整figure.height和figure.width,使用par(mar)和par(oma)修改边缘,但似乎没有任何作用。要么饼本身变得更小,要么标签被截断得更多。我希望饼能尽可能大,并且标签清晰可见,但每次渲染都会生成小饼和微小的标签。
是否有解决方法可以避免标签被截断(或可以与相邻的图表重叠)?任何建议都将不胜感激。
```{r, figure.align = "center", figure.height = 10, figure.width = 12}
par(mfrow=c(1,3), cex.axis=1.5, cex.lab=1.5)
par(mar = c(4,2,4,2))
par(oma = c(3, 3, 3, 3))
pie(a, labels = lbls, font = 2, col = c("tomato", "white"), cex=2)
pie(b, lbls2, font = 2, col = c("tomato", "white"), cex=2)
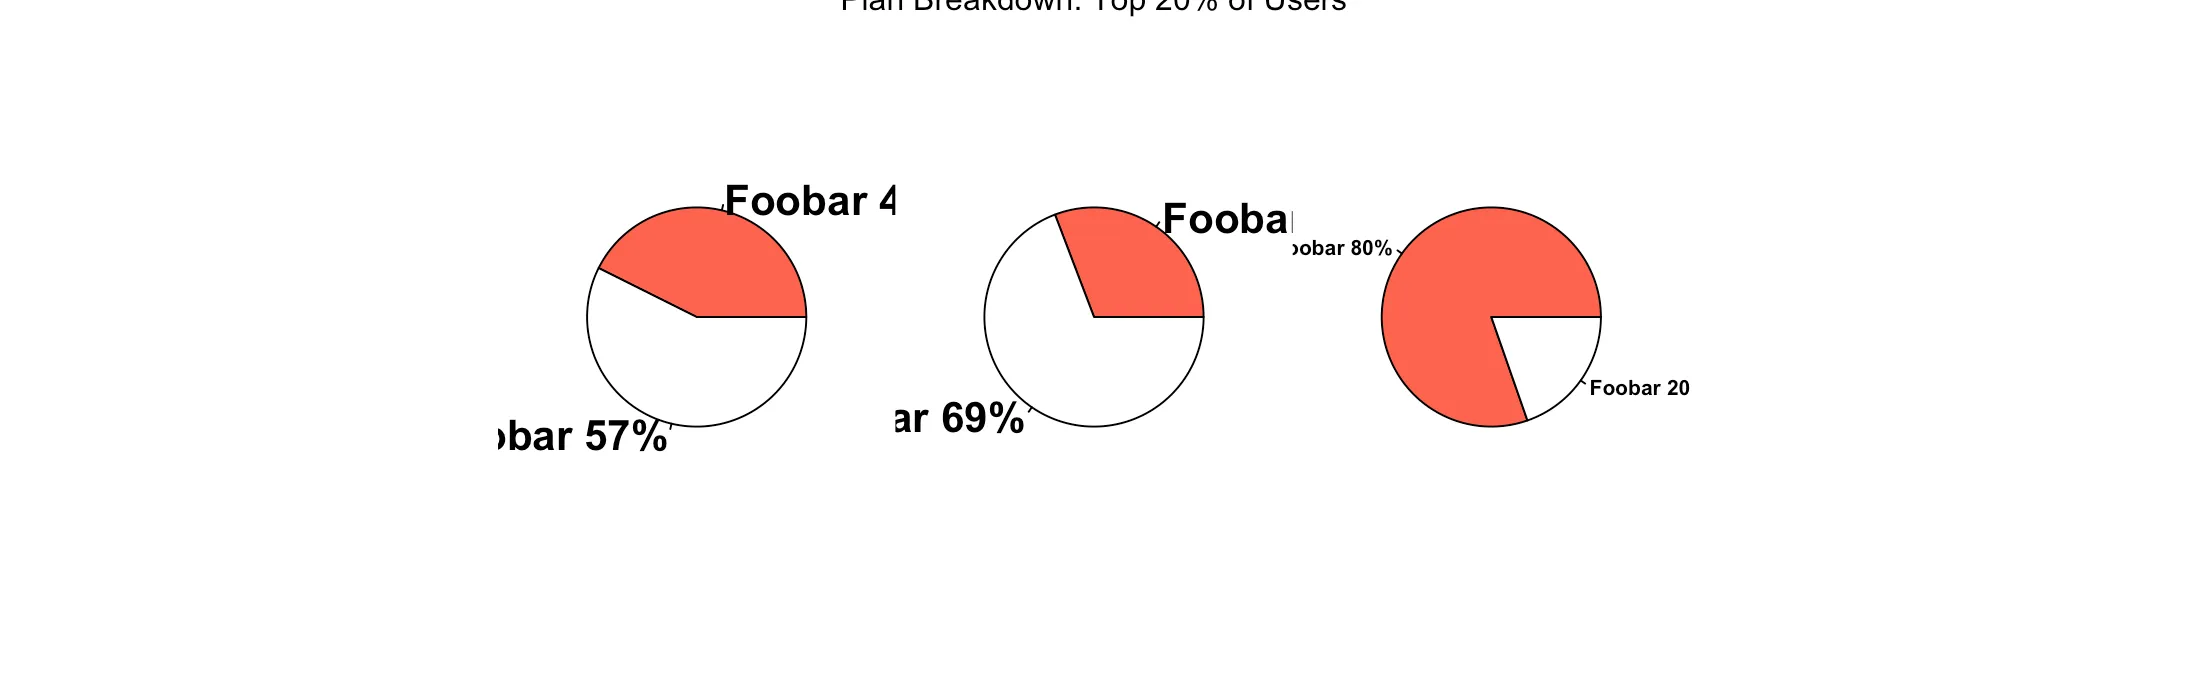
mtext(side=3, text="Plan Breakdown: Top 20% of Users")
pie(c, lbls3, font = 2, col = c("tomato", "white"))