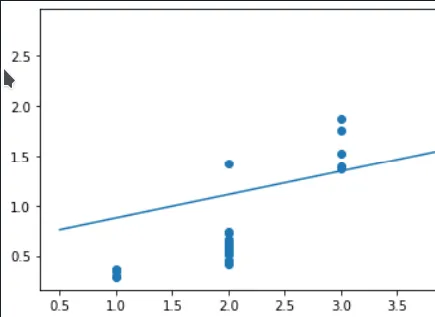
我想可视化拟合2D数据集的直线拟合过程。对于每个时代,我都有直线起点和终点的x和y坐标。下面是一个带有直线的数据集示例图像(使用matplotlib)。
数据框的外观如下:
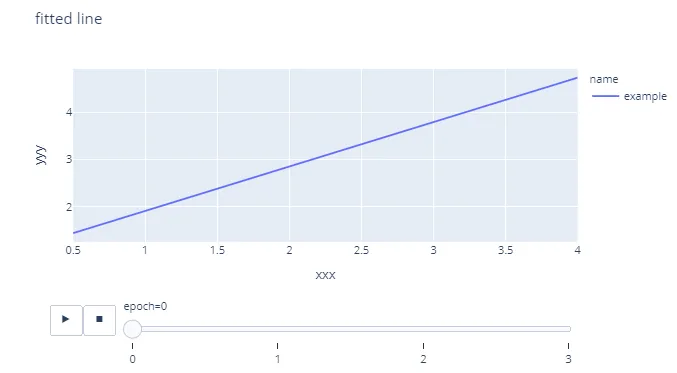
# this should animate my line
fig_data = px.line(df, x="xxx", y="yyy", animation_frame="epoch", animation_group="name", title="fitted line")
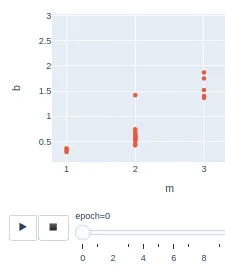
# responsible for the red scatter plot points:
fig_data.add_traces(
go.Scatter(
x=xxx,
y=yyy, mode='markers', name='House in Dataset')
)
数据框的外观如下:
epoch       xxx                                       yyy      name
0       0  [0.5, 4]   [1.4451884285714285, 4.730202428571428]  example
1       1  [0.5, 4]  [1.3944818842653062, 4.4811159469795925]  example
2       2  [0.5, 4]   [1.3475661354539474, 4.251154573663417]  example
3       3  [0.5, 4]    [1.3041510122346094, 4.03885377143571]  example
因此,在纪元0中应显示的线条始于(0.5,1.44),并延伸至(4,4.73)。但是,没有呈现任何线条。我应该改变什么?
datapoints_x和datapoint_y是从哪里来的? - jayveesea