我认为在tidyeval框架中“预期”的做法是使用名称(而不是字符串)输入参数,然后使用
enquo()引用这些参数。
ggplot2了解整洁的评估运算符,因此这对于
ggplot2也起作用。
首先,让我们调整您示例中的
dplyr摘要函数:
library(tidyverse)
library(rlang)

get_means <- function(df, metric, group) {

  metric = enquo(metric)
  group = enquo(group)

  df %>%
    group_by(!!group) %>%
    summarise(!!paste0("mean_", as_label(metric)) := mean(!!metric))
}

get_means(cats, weight, type)
  type    mean_weight
1 fat            20.0
2 not_fat        10.2
get_means(iris, Petal.Width, Species)
  Species    mean_Petal.Width
1 setosa                0.246
2 versicolor            1.33
3 virginica             2.03
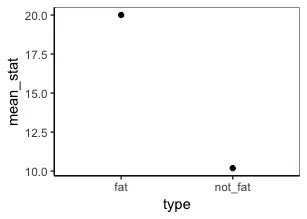
现在加入 ggplot:
get_means <- function(df, metric, group) {

  metric = enquo(metric)
  group = enquo(group)

  df %>%
    group_by(!!group) %>%
    summarise(mean_stat = mean(!!metric)) %>%
    ggplot(aes(!!group, mean_stat)) +
      geom_point()
}

get_means(cats, weight, type)
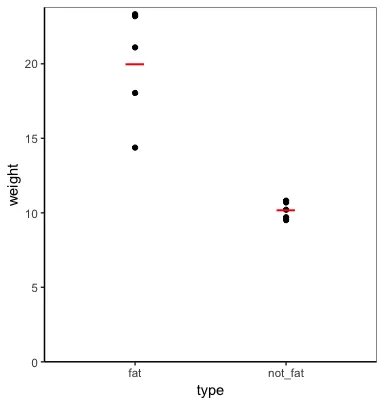
我不确定你想要什么类型的图表,但是你可以使用整洁评估绘制数据和摘要值。例如:
plot_func = function(data, metric, group) {

  metric = enquo(metric)
  group = enquo(group)

  data %>%
    ggplot(aes(!!group, !!metric)) +
      geom_point() +
      geom_point(data=. %>%
                   group_by(!!group) %>%
                   summarise(!!metric := mean(!!metric)),
                 shape="_", colour="red", size=8) +
      expand_limits(y=0) +
      scale_y_continuous(expand=expand_scale(mult=c(0,0.02)))
}

plot_func(cats, weight, type)
提醒一下,你可以使用...参数和enquos来允许函数接受任意数量的分组变量(包括没有分组变量),而不是使用enquo(这也需要使用!!!(取消引用-拼接)而不是!!(取消引用))。
get_means <- function(df, metric, ...) {

  metric = enquo(metric)
  groups = enquos(...)

  df %>%
    group_by(!!!groups) %>%
    summarise(!!paste0("mean_", quo_text(metric)) := mean(!!metric))
}
get_means(mtcars, mpg, cyl, vs)
    cyl    vs mean_mpg
1     4     0     26
2     4     1     26.7
3     6     0     20.6
4     6     1     19.1
5     8     0     15.1
get_means(mtcars, mpg)
  mean_mpg
1     20.1
quo_text()是不合适的。它是一个多行解析器。您可以使用as_label()或as_name()代替,它们保证返回单行字符串。后者检查其输入是否为变量名而不是函数调用,在许多情况下是适当的。在这里,as_label()很好,因为您的函数接受变量的内联转换,例如,您可以传递get_means(mtcars, mpg * 100)。 - Lionel Henryquo_text()一样,as_label()也是一个rlang函数。我的(可能不正确的)印象是,“平均”的tidyeval用户在正常编程过程中不需要使用rlang函数。有没有一种方法可以仅使用标准tidyverse包中的函数生成动态复合列名? - eipi10as_label()函数。 - Lionel Henry