Bokeh图中图例的位置

25

有谁知道如何将bokeh中的图例放置在图形之外吗?我所能做的唯一操作是在以下位置中选择一个位置:

top_right, top_left, bottom_left or bottom_right

使用:

legend()[0].orientation = "bottom_left"

当我尝试不同的选项时,会收到错误信息:

ValueError: invalid value for orientation: 'outside'; allowed values are top_right, top_left, bottom_left or bottom_right

还有一个与此密切相关的问题:如何保持原始轴的纵横比? - Karel Macek
2个回答

25

从 Bokeh 0.12.4 开始,可以将图例定位在中心绘图区域之外。以下是来自用户指南的简短示例:

import numpy as np
from bokeh.models import Legend
from bokeh.plotting import figure, show, output_file

x = np.linspace(0, 4*np.pi, 100)
y = np.sin(x)

output_file("legend_labels.html")

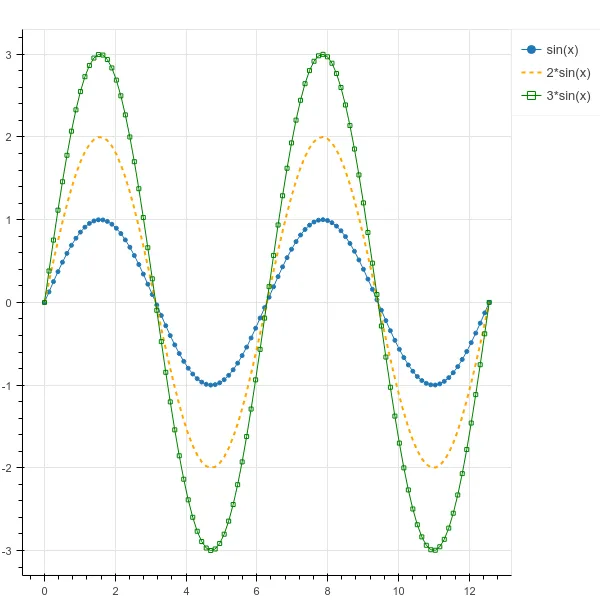
p = figure(toolbar_location="above")

r0 = p.circle(x, y)
r1 = p.line(x, y)

r2 = p.line(x, 2*y, line_dash=[4, 4], line_color="orange", line_width=2)

r3 = p.square(x, 3*y, fill_color=None, line_color="green")
r4 = p.line(x, 3*y, line_color="green")

legend = Legend(items=[
    ("sin(x)",   [r0, r1]),
    ("2*sin(x)", [r2]),
    ("3*sin(x)", [r3, r4])
], location=(0, -30))

p.add_layout(legend, 'right')

show(p)

要调整位置,请在location=(dx, dy)中更改dxdy

enter image description here


使用图表API,我该如何实现这个功能? - kynan
需要移动布局位置,这并不是一件容易的事情。我建议将这种问题带到邮件列表中讨论,因为可能需要一些实验和反复讨论才能找出答案。 - bigreddot
我已经为该功能提交了问题 - kynan
我更喜欢使用 location=(10, -30),这样图例和图形之间会有一小段距离。 - Steven C. Howell
还有一个与此密切相关的问题:如何保持原始坐标轴的纵横比? - Karel Macek
显示剩余2条评论

5

根据 Bokeh 文档 和 bigreddot,一种方法是使用Legend命令。我发现另一种方法。

如果在绘图函数(如 quad() 或 line())中使用legend_label参数,则图形标签将添加到p.legend。想要将图例放在正中央,可以使用p.legend.location = "center"命令。

若要将图例放在外部,则应使用p.add_layout(p.legend[0], 'right')命令。

以下是不同的示例代码。

import numpy as np

from bokeh.plotting import figure, output_file, show

x = np.linspace(0, 4*np.pi, 100)
y = np.sin(x)

output_file("legend_labels.html")

p = figure()

p.circle(x, y, legend_label="sin(x)")
p.line(x, y, legend_label="sin(x)")

p.line(x, 2*y, legend_label="2*sin(x)",
       line_dash=[4, 4], line_color="orange", line_width=2)

p.square(x, 3*y, legend_label="3*sin(x)", fill_color=None, line_color="green")
p.line(x, 3*y, legend_label="3*sin(x)", line_color="green")

p.legend.location = "center"

########################################################
# This line puts the legend outside of the plot area

p.add_layout(p.legend[0], 'right')
########################################################

show(p)

提醒其他尝试此方法的人:这会向您的图形添加重复的图例。如果您稍后尝试对图例进行其他操作(就像我一样),这将给您带来很多麻烦。只需按照顶部答案中推荐的方式手工制作一个图例对象即可。 - Ruben Flam-Shepherd

网页内容由stack overflow 提供, 点击上面的
可以查看英文原文,
原文链接