我正在尝试找到(但不绘制!)一些数据的等高线。
我知道
无济于事。我知道
我的最终目标是创建一个KML文件,在世界地图上绘制数据和相应的等高线。
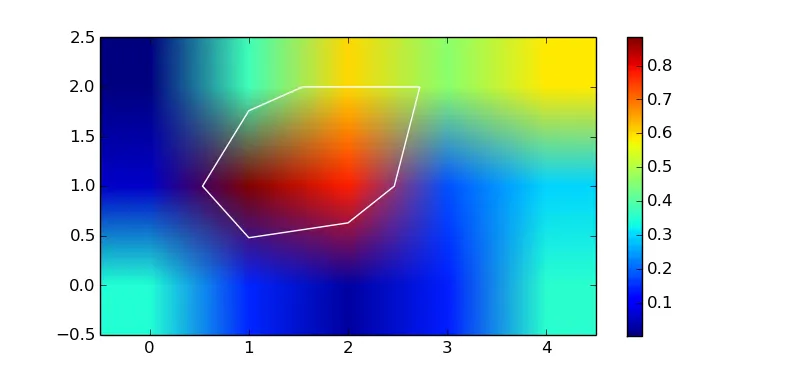
然而,由于我的数据点有些靠得很近,有些则相距较远,我需要实际构成等高线的多边形(线串),而不仅仅是等高线的栅格化图像。
我对
使用Mathematica的
我不能使用众所周知的CONREC算法,因为我的数据不在网格上(对于给定的x值,不总是有多个y值,反之亦然)。
解决方案不一定要使用Python,但必须是开源的,并且可以在Linux上运行。
from pprint import pprint
import matplotlib.pyplot
z = [[0.350087, 0.0590954, 0.002165], [0.144522, 0.885409, 0.378515],
     [0.027956, 0.777996, 0.602663], [0.138367, 0.182499, 0.460879],
     [0.357434, 0.297271, 0.587715]]
cn = matplotlib.pyplot.contour(z)
我知道
cn中包含了我想要的等高线,但是我似乎无法找到它们。我尝试了几种方法:print dir(cn)
pprint(cn.collections[0])
print dir(cn.collections[0])
pprint(cn.collections[0].figure)
print dir(cn.collections[0].figure)
无济于事。我知道
cn是一个ContourSet,cn.collections是一个LineCollection数组。我认为LineCollection是一个线段数组,但我无法弄清楚如何提取这些线段。我的最终目标是创建一个KML文件,在世界地图上绘制数据和相应的等高线。
然而,由于我的数据点有些靠得很近,有些则相距较远,我需要实际构成等高线的多边形(线串),而不仅仅是等高线的栅格化图像。
我对
qhull没有像这样的功能感到有些惊讶。使用Mathematica的
ListContourPlot然后导出为SVG可以实现,但我想使用一些开源工具。我不能使用众所周知的CONREC算法,因为我的数据不在网格上(对于给定的x值,不总是有多个y值,反之亦然)。
解决方案不一定要使用Python,但必须是开源的,并且可以在Linux上运行。
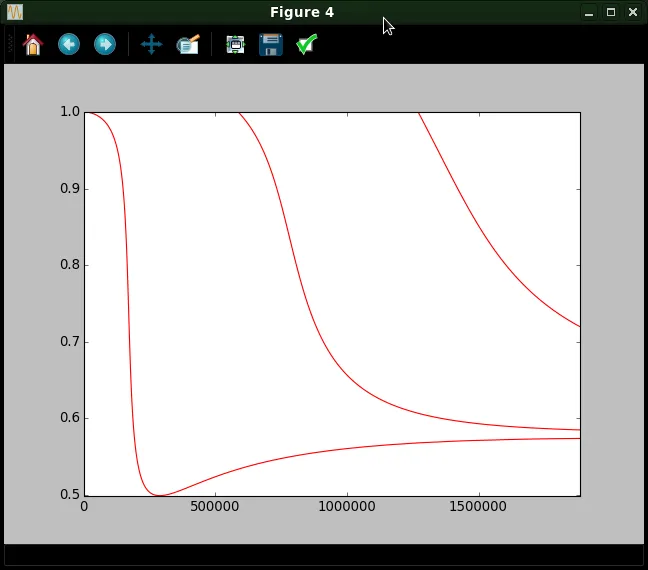 提取的曲线
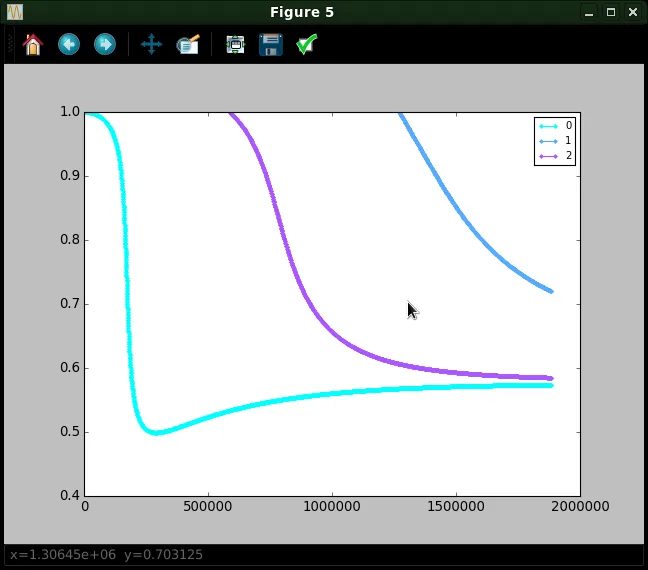
提取的曲线
contour和matplotlib.contour.QuadContourSet的源代码,您可以使用??IPython 魔法来检查函数或对象的源代码。请注意,未记录的组件可能会在未来版本的matplotlib中发生不可预知的更改。 - ali_mmatplotlib._cntr自matplotlib 2.2版本以来已不再可用,推荐的解决方案是使用http://scikit-image.org/docs/dev/auto_examples/edges/plot_contours.html。 - Fabzi