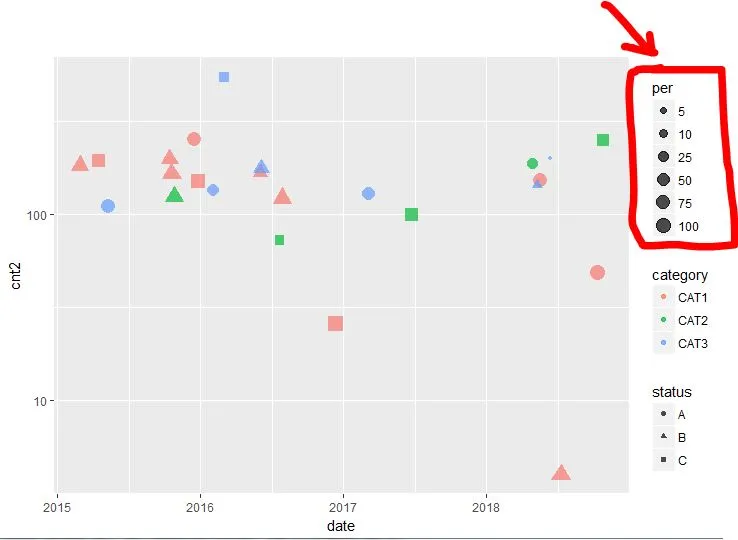
我需要在我的图表中使用三种形状,但是只有实心圆被用于尺寸图例(显示在图表上)。我正在尝试找到一种方法来在该图例中包含所有的形状,是否有办法做到呢?
数据框和绘图代码:
data <- structure(list(date = structure(c(1431388800, 1444780800, 1456876800,
    1469145600, 1469664000, 1425081600, 1445299200, 1488758400, 1524960000,
    1454544000, 1540512000, 1429228800, 1481587200, 1526688000, 1445904000,
    1498348800, 1464825600, 1451174400, 1450310400, 1539216000, 1528934400,
    1525996800, 1465084800, 1531180800), class = c("POSIXct", "POSIXt"
    ), tzone = "UTC"), cnt1 = c(76, 140, 99, 10, 123, 124, 160, 58,
    47, 43, 86, 112, 26, 123, 111, 49, 65, 93, 174, 49, 5, 16, 84,
    4), cnt2 = c(111, 200, 550, 73, 123, 184, 166, 131, 189, 136,
    250, 195, 26, 154, 125, 100, 168, 151, 255, 49, 200, 144, 177,
    4), per = c(68.4684684684685, 70, 18, 13.6986301369863, 100,
    67.3913043478261, 96.3855421686747, 44.2748091603053, 24.8677248677249,
    31.6176470588235, 34.4, 57.4358974358974, 100, 79.8701298701299,
    88.8, 49, 38.6904761904762, 61.5894039735099, 68.2352941176471,
    100, 2.5, 11.1111111111111, 47.4576271186441, 100), status = c("A",
    "B", "C", "C", "B", "B", "B", "A", "A", "A", "C", "C", "C", "A",
    "B", "C", "B", "C", "A", "A", "A", "B", "B", "B"), category = c("CAT3",
    "CAT1", "CAT3", "CAT2", "CAT1", "CAT1", "CAT1", "CAT3", "CAT2",
    "CAT3", "CAT2", "CAT1", "CAT1", "CAT1", "CAT2", "CAT2", "CAT1",
    "CAT1", "CAT1", "CAT1", "CAT3", "CAT3", "CAT3", "CAT1")), .Names = c("date",
    "cnt1", "cnt2", "per", "status", "category"), row.names = c(NA,
    -24L), class = c("tbl_df", "tbl", "data.frame"))


 ggplot(data, aes(x=date, y=cnt2)) +
      scale_y_log10(breaks=c(1,10,100,1000,5000)) +
      scale_size_continuous(trans="sqrt",range = c(1, 5),breaks=c(5,10,25,50,75,100)) +
      geom_point(aes(col=category, size=per, shape=status), alpha=0.7)
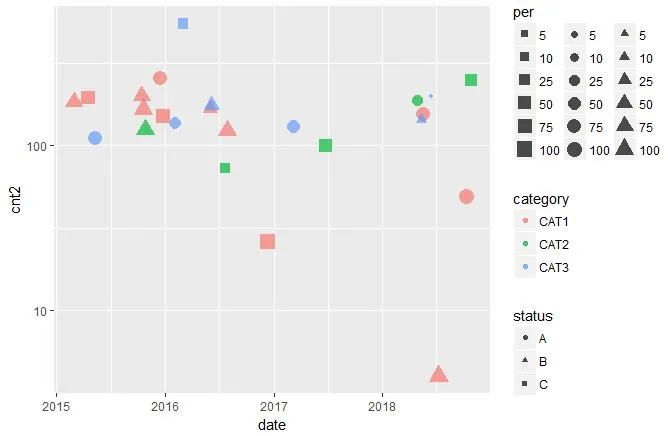
override.aes(在scale_size_*中添加guide = guide_legend(override.aes = list(shape = 17)))更改大小图例中的形状,但这并没有回答你的问题。你想让这样的图例是什么样子?你想象中有多列吗? - aosmith