早上好。
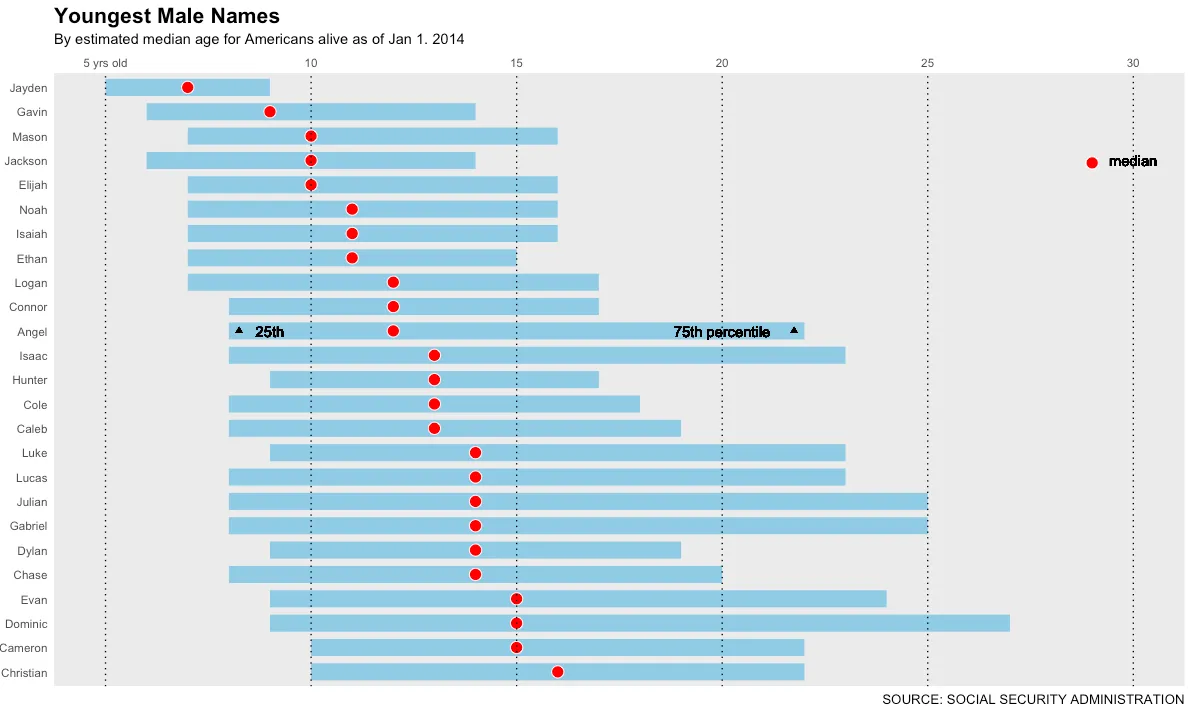
我正在尝试使用ggplot2包绘图,但遇到以下问题:
为了使它更易于理解,这里是我想要制作的目标图像。
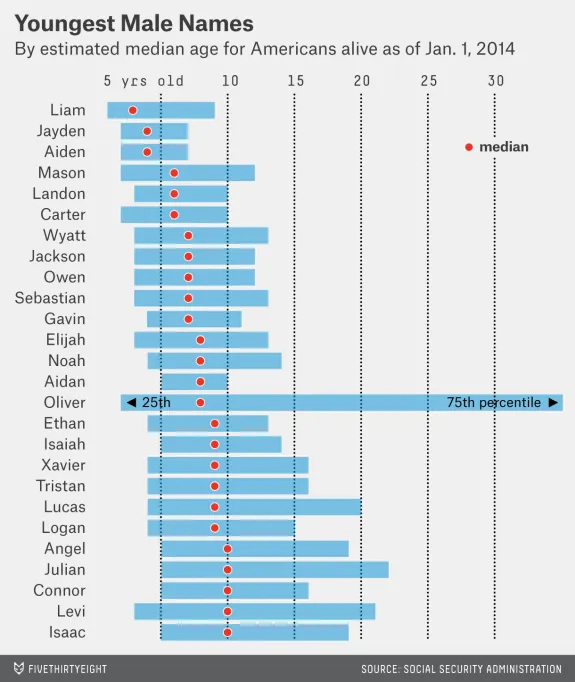
就像图片一样,我想要做以下事情:
1)在虚线上方放置文本“中位数”,以便清楚地看到字符。
2)旋转三角形的度数(不是^ ^而是< >),以使其有意义。
为了实现以上目标,我已经使用以下代码:
# binding the data, defining the x and y aesthetics, title, labels
w_plot <- ggplot(
  data = com_mal,
  aes(x = reorder(name, -median_age),  y = median_age)
)

labels = c('5 yrs old', 10, 15, 20, 25, 30)

w_plot +
  geom_linerange(
    aes(ymin = q1_age, ymax = q3_age),
    color = "#76bde0",
    size = 6,
    alpha = 0.7
  ) +
  geom_point(fill = "#ed3324", colour = "white", size = 4, shape = 21) +
  geom_text(aes(y = 9, x = 15, label = '25th')) +
  geom_text(aes(y = 20, x = 15, label = '75th percentile')) +
  geom_text(aes(y = 30, x = 22, label = 'median')) +
  geom_point(aes(y = 8.25, x = 15), shape = 17) +
  geom_point(aes(y = 21.75, x = 15), shape = 17) +
  geom_point(aes(y = 29, x = 21.9), fill = "#ed3324", colour = "white", size = 4, shape = 21) +
  geom_hline(aes(yintercept = 5), linetype = 'dotted') +
  geom_hline(aes(yintercept = 10), linetype = 'dotted') +
  geom_hline(aes(yintercept = 15), linetype = 'dotted') +
  geom_hline(aes(yintercept = 20), linetype = 'dotted') +
  geom_hline(aes(yintercept = 25), linetype = 'dotted') +
  geom_hline(aes(yintercept = 30), linetype = 'dotted') +
  scale_y_continuous(breaks = seq(5, 30, by = 5), position = 'right', labels = labels) +
  coord_flip() +
  labs(title = 'Youngest Male Names',
       subtitle = 'By estimated median age for Americans alive as of Jan 1. 2014',
       x = NULL, y = NULL, caption =  'SOURCE: SOCIAL SECURITY ADMINISTRATION') +
  theme(plot.title = element_text(face = 'bold', size = 16),
        panel.grid.major = element_blank(), panel.grid.minor = element_blank(),
        axis.ticks = element_blank(), plot.caption = element_text(size = 10))
非常感谢!
geom_label()替代geom_text。 - Romangeom_point,而是使用geom_polygon,其中你预先计算了两个三角形每个角的位置。在你的示例中,y坐标围绕y = 11居中(如果我数对了的话)。 - MrGumble