防止 ggplot2 中多层标题居中

5
这是我之前问题的第二部分(在使用R中的atop函数时如何获得恒定的文本大小)。
现在的问题是如何防止
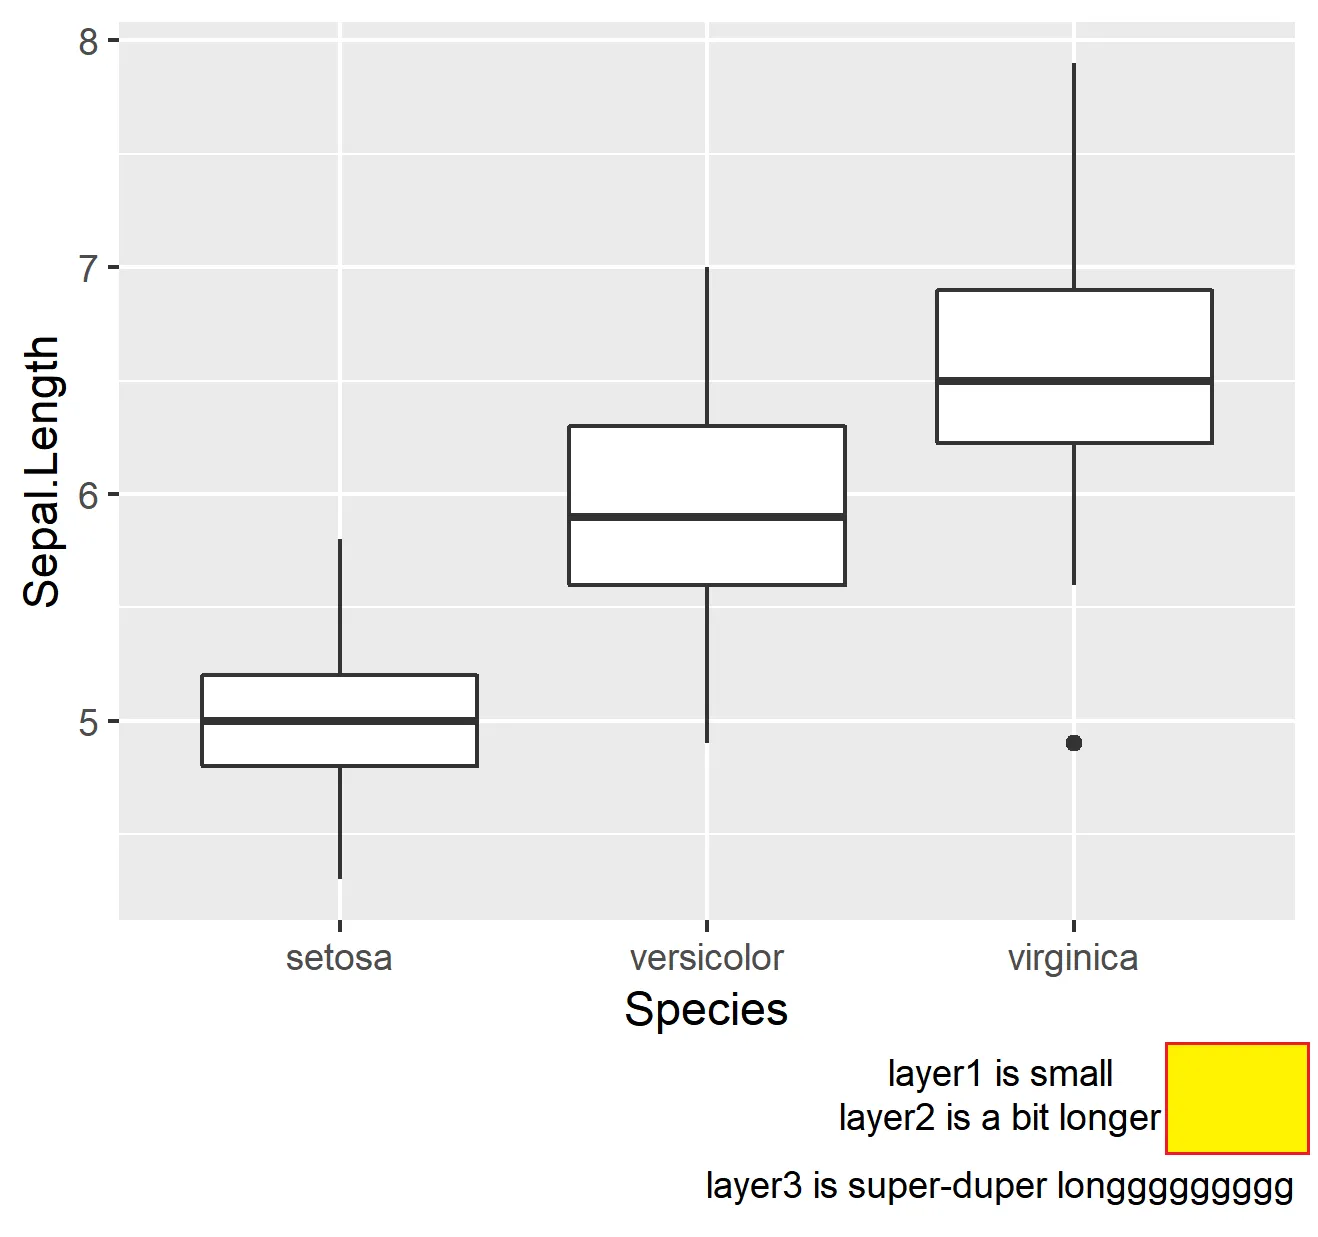
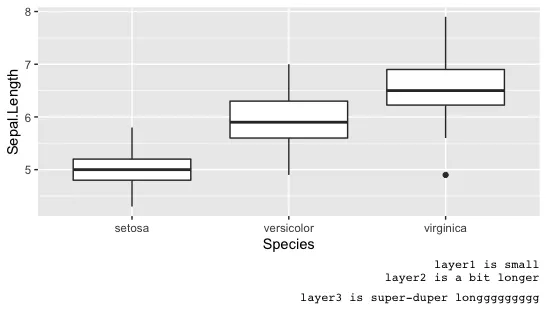
plotmath将文本居中以避免额外的间距(在此处用黄色突出显示)。我想要所有内容都靠右对齐。
(不幸的是,如果您的建议是将substitute替换为expression,我无法这样做。)
有什么建议吗?
library(ggplot2)

ggplot(iris, aes(Species, Sepal.Length)) +
  geom_boxplot()  +
  labs(caption = substitute(atop(
    atop(
      displaystyle("layer1 is small"),
      displaystyle("layer2 is a bit longer")
    ),
    "layer3 is super-duper longgggggggg"
  )))

enter image description here


1
已经有一些相关问题(参见 plotmath alignment)。例如,手动添加空格,如 https://dev59.com/U5Tfa4cB1Zd3GeqPUrYJ,是否可接受?与其手动尝试不同数量的空格,不如将其自动化。 - Julius Vainora
是的,但问题在于它们都使用expression来创建标题,而我正在使用substitute。提供的解决方案当然不适用于substitute。(如果你想知道为什么如此着迷于substitute,这就是我使用它的上下文- https://github.com/IndrajeetPatil/ggstatsplot/blob/c07736cc4abfc81430b3e725e57a60b883a444d9/R/helpers_ggbetween_subtitles.R#L167-L231) - Indrajeet Patil
1
所以我猜问题在于文本长度不固定。为什么不稍微更新一下你的示例,手动添加30个空格无法解决问题?然后我会尝试一下。 - Julius Vainora
“Layer 2”和“Layer 3”的文本长度是固定的,所以很容易修复。问题在于“Layer 1”,因为用户可以选择输入任意长度的“Caption”。 - Indrajeet Patil
2个回答

3

让我们从好消息开始。这里有一个函数,它将足够的前导空格添加到 from 上,以使其与列表 to 中最长的元素一样长:

push <- function(from, to)
  sprintf(paste("%", max(nchar(from), max(nchar(to))), "s"), from)

接下来我们有三个层级,也可以使用substitute(据我了解,在您的情况下只有第一个层级使用它)。
l1 <- substitute("layer1 is small")
l2 <- "layer2 is a bit longer"
l3 <- "layer3 is super-duper longgggggggg"

现在不好的消息是,push 只对等宽字体(mono fonts)有效,而这不是 ggplot2 的默认字体。因为有很多关于字体的问题,所以如果您愿意,可以导入其他的等宽字体。

ggplot(iris, aes(Species, Sepal.Length)) +
  geom_boxplot()  +
  labs(caption = substitute(atop(atop(textstyle(l1), textstyle(l2)), textstyle(l3)), 
                            list(l1 = push(l1, list(l2 ,l3)),
                                 l2 = push(l2, list(l1, l3)), 
                                 l3 = push(l3, list(l2, l3))))) +
  theme(plot.caption = element_text(family = "mono"))

enter image description here


1
最简单的办法可能是在gtable中逐行添加文本grobs。
gtable_add_caption <- function(p, cap, g = ggplotGrob(p), 
                               hjust=1, x=unit(1,"npc"), pad = unit(c(2,2),"mm"),
                               ...){

  for(ii in seq_along(cap)){
    line <- tryCatch(parse(text = cap[ii]), error = function(e) cap[ii])
    tg <- textGrob(line, x = x - pad[1], hjust = hjust, gp=gpar(...))
    hg <- grobHeight(tg) 
    g <- gtable_add_rows(g, hg + pad[2])
    g <- gtable_add_grob(g, tg, t = nrow(g), l=1, r=ncol(g))
  }

  g
}

p <- ggplot()
ggplot(iris, aes(Species, Sepal.Length)) +
  geom_boxplot() ->p
g <- gtable_add_caption(p, c("first line", "integral(frac(1,x-1)*dx,alpha,beta)", "thirdddddddddddddddddd line"))
grid.newpage()
grid.draw(g)

网页内容由stack overflow 提供, 点击上面的
可以查看英文原文,
原文链接