Chart.js v2:如何使饼图上的工具提示始终显示?

33

我在Stack Overflow上找到了类似的问题,但它们都是一年或两年前解决的。现在Chart.js已经升级到版本2,并且文档发生了很多变化。请问有人能够帮忙展示一个带标签的饼图示例 - 或者是所有分段工具提示都可见的饼图?

更新

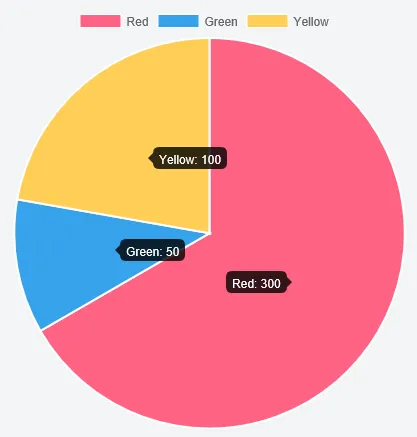
感谢@potatopeelings,他的答案在Chart.js v2.1中完美地工作。

虽然我最初在这里问如何永久显示饼图工具提示,但我发现了一个更好的解决方案:将值以百分比形式显示为标签!现在在Chart.js v2.1中启用了饼图的选项:

animation: {
  duration: 0,
  onComplete: function () {
    var self = this,
        chartInstance = this.chart,
        ctx = chartInstance.ctx;

    ctx.font = '18px Arial';
    ctx.textAlign = "center";
    ctx.fillStyle = "#ffffff";

    Chart.helpers.each(self.data.datasets.forEach(function (dataset, datasetIndex) {
        var meta = self.getDatasetMeta(datasetIndex),
            total = 0, //total values to compute fraction
            labelxy = [],
            offset = Math.PI / 2, //start sector from top
            radius,
            centerx,
            centery, 
            lastend = 0; //prev arc's end line: starting with 0

        for (var val of dataset.data) { total += val; } 

        Chart.helpers.each(meta.data.forEach( function (element, index) {
            radius = 0.9 * element._model.outerRadius - element._model.innerRadius;
            centerx = element._model.x;
            centery = element._model.y;
            var thispart = dataset.data[index],
                arcsector = Math.PI * (2 * thispart / total);
            if (element.hasValue() && dataset.data[index] > 0) {
              labelxy.push(lastend + arcsector / 2 + Math.PI + offset);
            }
            else {
              labelxy.push(-1);
            }
            lastend += arcsector;
        }), self)

        var lradius = radius * 3 / 4;
        for (var idx in labelxy) {
          if (labelxy[idx] === -1) continue;
          var langle = labelxy[idx],
              dx = centerx + lradius * Math.cos(langle),
              dy = centery + lradius * Math.sin(langle),
              val = Math.round(dataset.data[idx] / total * 100);
          ctx.fillText(val + '%', dx, dy);
        }

    }), self);
  }
},

我认为这就是你要找的。https://dev59.com/y18e5IYBdhLWcg3whqrl#25913101 - Luke
@Luke 你好,谢谢抽出时间来。不幸的是,那个例子使用的是chart.js v1.0.2版本。v2中的数据结构和配置与v1不同。 - Danny
1
我会使用这个: https://github.com/chartjs/chartjs-plugin-datalabels. 这个插件应该能够满足你的需求。 - FranzHuber23
5个回答

31

ChartJs版本>2.1.5的解决方案:

Chart.pluginService.register({
  beforeRender: function (chart) {
    if (chart.config.options.showAllTooltips) {
        // create an array of tooltips
        // we can't use the chart tooltip because there is only one tooltip per chart
        chart.pluginTooltips = [];
        chart.config.data.datasets.forEach(function (dataset, i) {
            chart.getDatasetMeta(i).data.forEach(function (sector, j) {
                chart.pluginTooltips.push(new Chart.Tooltip({
                    _chart: chart.chart,
                    _chartInstance: chart,
                    _data: chart.data,
                    _options: chart.options.tooltips,
                    _active: [sector]
                }, chart));
            });
        });

        // turn off normal tooltips
        chart.options.tooltips.enabled = false;
    }
},
  afterDraw: function (chart, easing) {
    if (chart.config.options.showAllTooltips) {
        // we don't want the permanent tooltips to animate, so don't do anything till the animation runs atleast once
        if (!chart.allTooltipsOnce) {
            if (easing !== 1)
                return;
            chart.allTooltipsOnce = true;
        }

        // turn on tooltips
        chart.options.tooltips.enabled = true;
        Chart.helpers.each(chart.pluginTooltips, function (tooltip) {
            tooltip.initialize();
            tooltip.update();
            // we don't actually need this since we are not animating tooltips
            tooltip.pivot();
            tooltip.transition(easing).draw();
        });
        chart.options.tooltips.enabled = false;
    }
  }
});

4
谢谢!在2.4.0版本中,它已更改为Chart.plugins.register。 - Evil Pigeon
1
@Fl0R1D3R - 有没有办法让工具提示“面对另一边”?目前它们朝向中心,这对于小图表来说是一个问题:\会感激您的想法。 - st2rseeker
我想添加一个可以帮助他人的改进。增加一个检查,以确保数字小于0。 if(chart.data.datasets[0].data[j] > 0){ chart.pluginTooltips.push(new Chart.Tooltip({ .... }, chart)); } - Guilherme Felipe Reis
我该如何为每个工具提示添加事件处理程序? - Joshua Richards

20

使用新的Chart.js 2.1版本,您可以编写一个插件,通过options属性控制它。


预览

enter image description here


脚本

请注意,在初始化图表之前需要注册插件。

Chart.pluginService.register({
    beforeRender: function (chart) {
        if (chart.config.options.showAllTooltips) {
            // create an array of tooltips
            // we can't use the chart tooltip because there is only one tooltip per chart
            chart.pluginTooltips = [];
            chart.config.data.datasets.forEach(function (dataset, i) {
                chart.getDatasetMeta(i).data.forEach(function (sector, j) {
                    chart.pluginTooltips.push(new Chart.Tooltip({
                        _chart: chart.chart,
                        _chartInstance: chart,
                        _data: chart.data,
                        _options: chart.options,
                        _active: [sector]
                    }, chart));
                });
            });

            // turn off normal tooltips
            chart.options.tooltips.enabled = false;
        }
    },
    afterDraw: function (chart, easing) {
        if (chart.config.options.showAllTooltips) {
            // we don't want the permanent tooltips to animate, so don't do anything till the animation runs atleast once
            if (!chart.allTooltipsOnce) {
                if (easing !== 1)
                    return;
                chart.allTooltipsOnce = true;
            }

            // turn on tooltips
            chart.options.tooltips.enabled = true;
            Chart.helpers.each(chart.pluginTooltips, function (tooltip) {
                tooltip.initialize();
                tooltip.update();
                // we don't actually need this since we are not animating tooltips
                tooltip.pivot();
                tooltip.transition(easing).draw();
            });
            chart.options.tooltips.enabled = false;
        }
    }
});

然后

new Chart(ctx, {
    type: 'pie',
    data: data,
    options: {
        showAllTooltips: true
        ...

使用旧版2.x版本,您应该能够将相同的(或类似的,我不确定早期的数据结构)移动到options.animation.onComplete中。


Fiddle - http://jsfiddle.net/q15ta78q/


当有多个数据为0时,不显示所有的工具提示。链接http://jsfiddle.net/q15ta78q/43/应该显示,红色-0,绿色-0,但只显示绿色-0。如何处理这种情况?有一个开放性问题,如果你能回答就好了。问题链接:http://stackoverflow.com/questions/37790727/chart-js-donut-doughnut-chart-tooltip-to-be-shown-always-for-all-the-data-all - Raghu
6
我正在使用charts.js 2.2.1,如果你把 _options : chart.options 改成 _options : chart.options.tooltips 就可以正常工作。 - jessica
我收到了错误信息:Chart.Tooltip.positioners[opts.position]不是一个函数(版本2.4.0)。 - LauraNMS
1
@potatopeelings - 有没有办法让工具提示“面向另一边”?目前它们面向中心,这对于小图表来说是个问题:\ 我会感激你的建议。 - st2rseeker
@potatopeelings,是否有一种方法可以在AngularChart中实现相同的功能? - Ravi Khambhati

15

我在寻找相似的解决方案时,发现了这个Chart.js插件Chart.PieceLabel.js。它有配置选项可以显示标签、值和百分比等模式。


1
这正是我在寻找的,谢谢! - XVirtusX
2
这个插件在循环中出现了洪水般的问题。它能够工作,但是运行非常缓慢。 - NVRM

4

0

网页内容由stack overflow 提供, 点击上面的
可以查看英文原文,
原文链接