我最近将我的charts.js库更新至最新版本(2.5.0),但这个版本在图表上不显示标签。
我有一个在fiddler上工作的示例:http://jsfiddle.net/g6fajwg8。
然而,我完全按照示例定义了我的图表,但仍无法看到图表上的标签。
注:谷歌和Stackoverflow上有很多类似的问题,但大多数是关于之前的版本,而在那些版本中它们可以正常工作。
var config = {
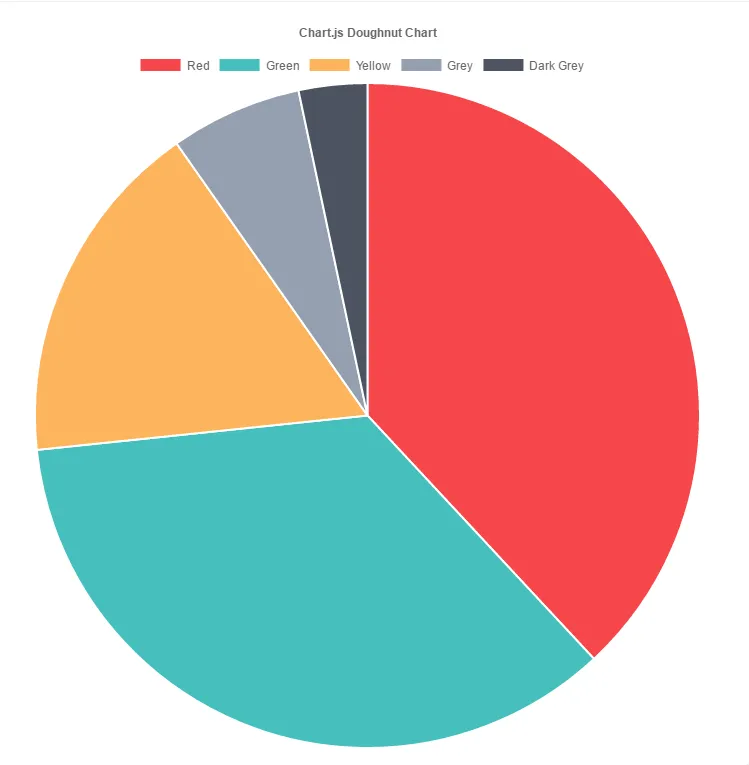
type: 'pie',
data: {
datasets: [{
data: [
1200,
1112,
533,
202,
105,
],
backgroundColor: [
"#F7464A",
"#46BFBD",
"#FDB45C",
"#949FB1",
"#4D5360",
],
label: 'Dataset 1'
}],
labels: [
"Red",
"Green",
"Yellow",
"Grey",
"Dark Grey"
]
},
options: {
responsive: true,
legend: {
position: 'top',
},
title: {
display: true,
text: 'Chart.js Doughnut Chart'
},
animation: {
animateScale: true,
animateRotate: true
}
}
};
window.pPercentage = new Chart(ChartContext, config);