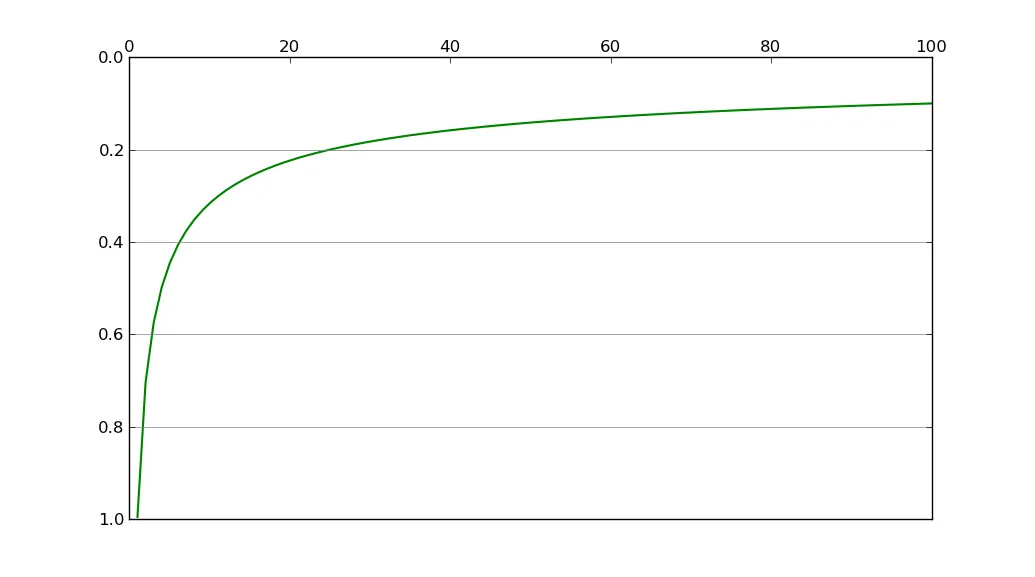
我想问如何制作类似于下图的图表?基本上,如何将x轴放在图表顶部。谢谢。
图片来源:http://oceanographyclay1987.blogspot.com/2010/10/light-attenuation-in-ocean.html
图片来源:http://oceanographyclay1987.blogspot.com/2010/10/light-attenuation-in-ocean.html
使用
ax.xaxis.set_ticks_position("top")
import numpy as np
import matplotlib.pyplot as plt

numdata = 100
t = np.linspace(0, 100, numdata)
y = 1/t**(1/2.0)

fig = plt.figure()
ax = fig.add_subplot(1, 1, 1)
ax.xaxis.set_ticks_position('top')
ax.yaxis.grid(linestyle = '-', color = 'gray')
ax.invert_yaxis()
ax.plot(t, y, 'g-', linewidth = 1.5)

plt.show()