在Qt中显示matplotlib的imshow输出

3

我有一个类型为np.float64的二维numpy数组,我想将其显示为QLabel中的图像(或任何其他有效方式):

self.img = np.rot90(get_my_data()) # this line returns a 2D numpy array of type np.float64
self.qimg = QtGui.QImage(self.img, self.img.shape[0], self.img.shape[1], QtGui.QImage.Format_Grayscale8)
self.myLabel.setPixmap(QtGui.QPixmap(self.qimg))

我上面的代码返回了以下错误:

TypeError: arguments did not match any overloaded call:
QImage(): too many arguments
QImage(QSize, QImage.Format): argument 1 has unexpected type 'numpy.ndarray'
QImage(int, int, QImage.Format): argument 1 has unexpected type 'numpy.ndarray'
QImage(bytes, int, int, QImage.Format): argument 1 has unexpected type 'numpy.ndarray'
QImage(sip.voidptr, int, int, QImage.Format): argument 1 has unexpected type 'numpy.ndarray'
QImage(bytes, int, int, int, QImage.Format): argument 1 has unexpected type 'numpy.ndarray'
QImage(sip.voidptr, int, int, int, QImage.Format): argument 1 has unexpected type 'numpy.ndarray'
QImage(List[str]): argument 1 has unexpected type 'numpy.ndarray'
QImage(str, format: str = None): argument 1 has unexpected type 'numpy.ndarray'
QImage(QImage): argument 1 has unexpected type 'numpy.ndarray'
QImage(Any): too many arguments

但是,如果我在第一行的末尾添加.copy(),那么它就可以工作了!但是它不会正确地显示数据。

self.img = np.rot90(get_my_data()).copy()
self.qimg = QtGui.QImage(self.img, self.img.shape[0], self.img.shape[1], QtGui.QImage.Format_Grayscale8)
self.myLabel.setPixmap(QtGui.QPixmap(self.qimg))

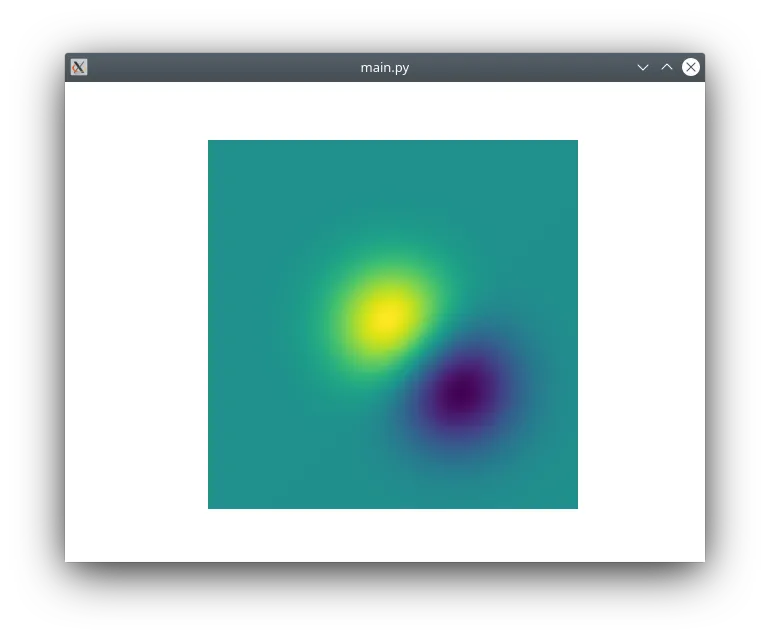
以下是标签与pyplot.imshow()的显示效果对比:

self.img = 20 * np.log10(np.rot90(get_my_data()).copy())
self.qimg = QtGui.QImage(self.img, self.img.shape[0], self.img.shape[1], QtGui.QImage.Format_Grayscale8)
self.myLabel.setPixmap(QtGui.QPixmap(self.qimg))
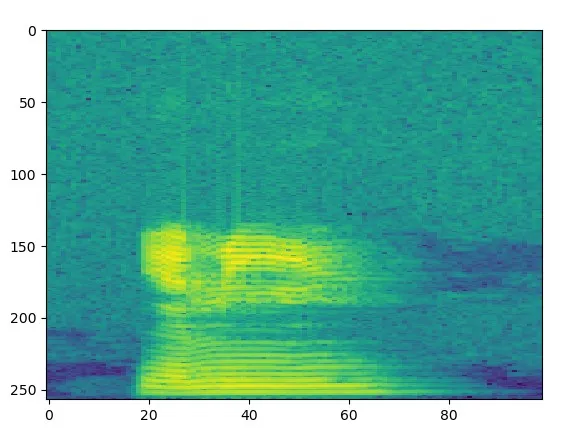
pyplot.imshow(self.img)
pyplot.show()

pyplot.imshow() 的结果是:
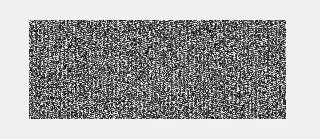
enter image description here

myLabel 显示的结果如下:

enter image description here

那么,我的代码有什么问题吗?

有没有更好的方法将我的 2D numpy 数组显示为图像?


get_my_data() 函数返回的数值范围是多少?如果它们是浮点数,那么你不能直接使用它们。图像格式接受 1、8、16、24、32 或 64 位(作为“整数”值)格式。如果你知道数据的范围,那么你可以将数组转换为整数值。例如,如果它们在 0 到 1 之间,那么类似这样的代码可能会起作用(假设你想要 8 位转换):self.img = np.multiply(get_my_data(), 127).astype('int8') - musicamante
@musicamante 我的一个样本具有范围 [3.2101597817728964e-05 12684375.661213763],我无法一般性地确定最大和最小值,那么该怎么处理呢?并且如何使用 QImage 显示结果为 int8 类型的二维 numpy 数组?谢谢。 - catfour
@eyllanesc 我希望可以,但这是一个相当大的STFT实现。然而,我正在对结果进行20 * np.log10操作,正如您所看到的那样。 - catfour
1个回答

4
我所阅读的内容显示,OP存在一个 XY问题,即其目标是在Qt窗口中显示imshow()的输出结果,但询问如何尝试在QImage中显示数据。 imshow()方法不显示原始数据,而是根据文档中指定的参数处理信息:

matplotlib.pyplot.imshow(X, cmap=None, norm=None, aspect=None, interpolation=None, alpha=None, vmin=None, vmax=None, origin=None, extent=None, shape=, filternorm=1, filterrad=4.0, imlim=, resample=None, url=None, *, data=None, **kwargs)

因此,如果您想要获得带有该数据的图像,则必须实现该算法(您可以检查matplotlib或类似软件的源代码以分析逻辑)。
如果我们关注真正的目标,那么最简单的解决方案是使用matplotlib的Qt后端获取适当的画布,如下所示:
import numpy as np

from PyQt5 import QtWidgets
from matplotlib.backends.backend_qt5agg import FigureCanvas
from matplotlib.figure import Figure


class MainWindow(QtWidgets.QMainWindow):
    def __init__(self, parent=None):
        super().__init__(parent)

        self.figure = Figure(figsize=(5, 3))
        self.canvas = FigureCanvas(self.figure)
        self.ax = self.figure.subplots()

        delta = 0.025
        x = y = np.arange(-3.0, 3.0, delta)
        X, Y = np.meshgrid(x, y)
        Z1 = np.exp(-(X ** 2) - Y ** 2)
        Z2 = np.exp(-((X - 1) ** 2) - (Y - 1) ** 2)
        Z = (Z1 - Z2) * 2

        self.ax.imshow(Z)
        self.ax.set_axis_off()

        self.setCentralWidget(self.canvas)


if __name__ == "__main__":
    import sys

    app = QtWidgets.QApplication(sys.argv)
    w = MainWindow()
    w.resize(640, 480)
    w.show()

    sys.exit(app.exec_())

enter image description here

更新:

如果您想定时显示数据,则可以使用QTimer定时器,它会按照下面所示的方式更新信息:

import random
import numpy as np

from PyQt5 import QtCore, QtWidgets
from matplotlib.backends.backend_qt5agg import FigureCanvas
from matplotlib.figure import Figure


class MainWindow(QtWidgets.QMainWindow):
    def __init__(self, parent=None):
        super().__init__(parent)

        self.figure = Figure(figsize=(5, 3))
        self.canvas = FigureCanvas(self.figure)
        self.ax = self.figure.subplots()
        self.ax.set_axis_off()

        self.setCentralWidget(self.canvas)

        timer = QtCore.QTimer(self)
        timer.timeout.connect(self.on_timeout)
        timer.start(100)

    def on_timeout(self):
        x0, y0 = random.uniform(-2, 2), random.uniform(-2, 2)
        delta = 0.025
        x = y = np.arange(-3.0, 3.0, delta)
        X, Y = np.meshgrid(x, y)
        Z1 = np.exp(-(X ** 2) - Y ** 2)
        Z2 = np.exp(-((X - x0) ** 2) - (Y - y0) ** 2)
        Z = (Z1 - Z2) * 2
        self.ax.imshow(Z)
        self.canvas.draw()


if __name__ == "__main__":
    import sys

    app = QtWidgets.QApplication(sys.argv)
    w = MainWindow()
    w.resize(640, 480)
    w.show()

    sys.exit(app.exec_())

另一方面,如果您想要实时SW,则GUI将限制该目标。建议每N个样本显示一次数据,以便GUI不被阻塞,用户可以查看和分析信息。人眼反应速度很慢,因此即使存在每微秒显示图像的技术,我们的视觉也无法欣赏它,我们的视觉需要60ms来处理图像,因此设备设计为在30Hz下工作,因为如果频率超过这个值,改进效果将不会被观察到。

get_my_data() 的结果是 $|STFT|^2$,因为我需要在窗口的特定区域尽可能简单地显示我的音频数据的实时频谱图,无论使用什么小部件。然而,我使用 PyQtGraph 显示实时音频数据,与 Matplotlib 相比绘制速度非常快。因此,如果您编辑您的答案以显示实时频谱图(如上所示的 2D 图像),我将不胜感激。谢谢。 - catfour
@catfour,你所描述的问题属于 XY 问题,我建议你重新撰写问题以表明你的真实目标。在标题中,你表示想要将其转换为 QImage,但实际上你想要获得一个与 matplotlib 的 imshow 方法显示相当的 QImage。 - eyllanesc

网页内容由stack overflow 提供, 点击上面的
可以查看英文原文,
原文链接