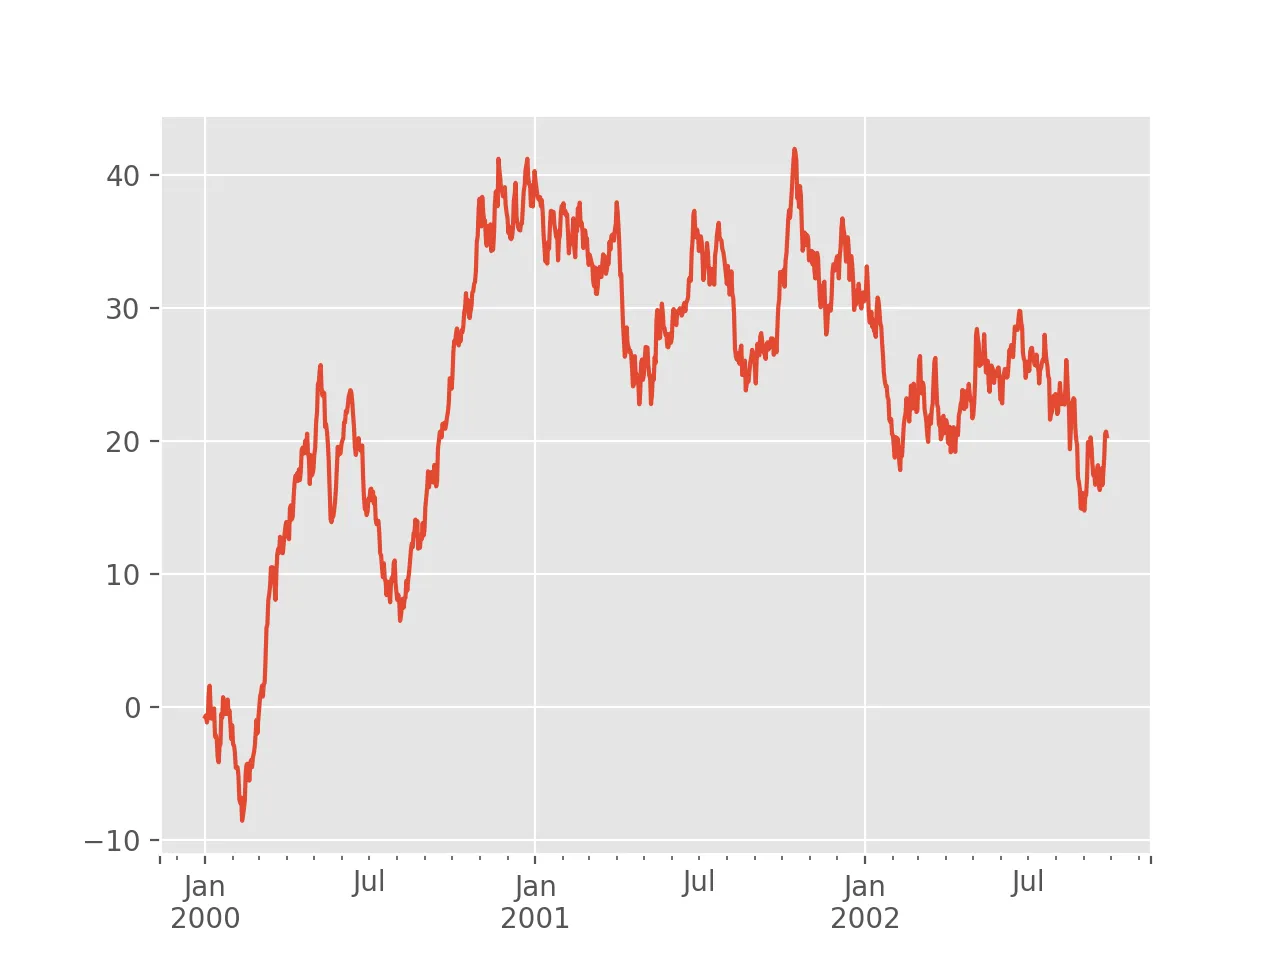
当运行数据框或系列的
我正在使用Python 3.6,所有其他功能都按预期工作,因此不确定可能导致此问题的原因。
以下是导致该问题的代码示例,下面是结果的错误。
返回的错误如下所示:
plot()方法时,Python会抛出错误。错误的最后一行是NameError:name'_converter'未定义。我正在使用Python 3.6,所有其他功能都按预期工作,因此不确定可能导致此问题的原因。
以下是导致该问题的代码示例,下面是结果的错误。
import pandas as pd
import numpy as np
import matplotlib
import matplotlib.pyplot as plt

ts = pd.Series(np.random.randn(1000), index=pd.date_range('1/1/2000', periods=1000))
ts = ts.cumsum()
ts.plot()
返回的错误如下所示:
NameError                                 Traceback (most recent call last)
<ipython-input-336-8fe4bd433d4d> in <module>()
----> 1 ts.plot()
      2
      3 plt.plot(ts)

c:\users\fguih\appdata\local\programs\python\python36\lib\site-packages\pandas\plotting\_core.py in __call__(self, kind, ax, figsize, use_index, title, grid, legend, style, logx, logy, loglog, xticks, yticks, xlim, ylim, rot, fontsize, colormap, table, yerr, xerr, label, secondary_y, **kwds)
   2501                            colormap=colormap, table=table, yerr=yerr,
   2502                            xerr=xerr, label=label, secondary_y=secondary_y,
-> 2503                            **kwds)
   2504     __call__.__doc__ = plot_series.__doc__
   2505

c:\users\fguih\appdata\local\programs\python\python36\lib\site-packages\pandas\plotting\_core.py in plot_series(data, kind, ax, figsize, use_index, title, grid, legend, style, logx, logy, loglog, xticks, yticks, xlim, ylim, rot, fontsize, colormap, table, yerr, xerr, label, secondary_y, **kwds)
   1925                  yerr=yerr, xerr=xerr,
   1926                  label=label, secondary_y=secondary_y,
-> 1927                  **kwds)
   1928
   1929

c:\users\fguih\appdata\local\programs\python\python36\lib\site-packages\pandas\plotting\_core.py in _plot(data, x, y, subplots, ax, kind, **kwds)
   1725                             pass
   1726                 data = series
-> 1727         plot_obj = klass(data, subplots=subplots, ax=ax, kind=kind, **kwds)
   1728
   1729     plot_obj.generate()

c:\users\fguih\appdata\local\programs\python\python36\lib\site-packages\pandas\plotting\_core.py in __init__(self, data, **kwargs)
    929
    930     def __init__(self, data, **kwargs):
--> 931         MPLPlot.__init__(self, data, **kwargs)
    932         if self.stacked:
    933             self.data = self.data.fillna(value=0)

c:\users\fguih\appdata\local\programs\python\python36\lib\site-packages\pandas\plotting\_core.py in __init__(self, data, kind, by, subplots, sharex, sharey, use_index, figsize, grid, legend, rot, ax, fig, title, xlim, ylim, xticks, yticks, sort_columns, fontsize, secondary_y, colormap, table, layout, **kwds)
     98                  table=False, layout=None, **kwds):
     99
--> 100         _converter._WARN = False
    101         self.data = data
    102         self.by = by

NameError: name '_converter' is not defined

from pandas.plotting import _converter被放置在try/except子句中,但不清楚原因),或者是文档缺少更新。 - ImportanceOfBeingErnest