我有一些范围从0到10000的整数。我想要为每个整数映射一种颜色。然后根据整数值,我想要检索与整数值对应的颜色的RGB等效值。基本上,我想在两种或更多颜色之间实现插值效果,例如,如果颜色是绿色和红色,则绿色具有最小权重(0),红色具有最高权重(10000)。我如何使用matplotlib实现此映射,或者是否有其他库可以实现相同的功能?
2个回答
10
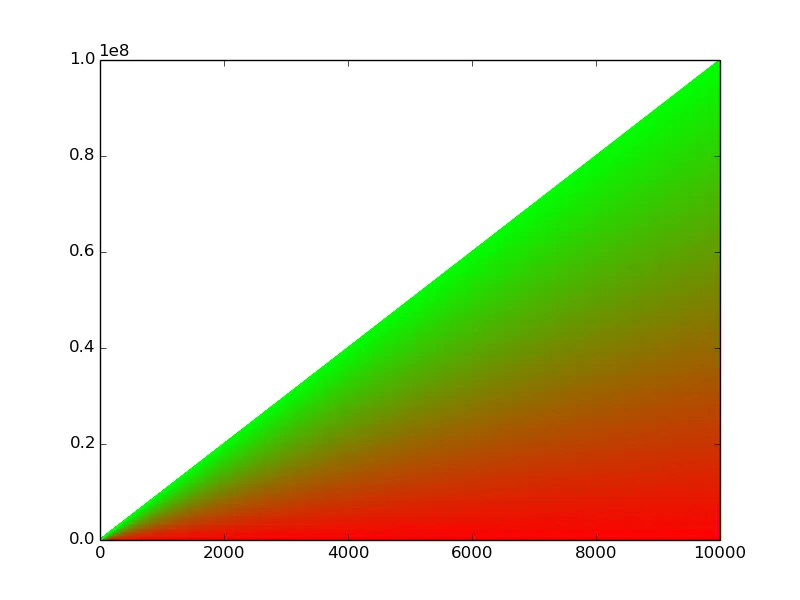
确实可以从给定的色图中采样10000种颜色:
#!/usr/bin/python3

from numpy import arange

from matplotlib import pyplot as plt
from matplotlib import cm
from matplotlib.colors import LinearSegmentedColormap


# ======
## data:

N = 10000
data = arange(N +1)


# =================
## custom colormap:

# red-green colormap:
cdict = {'red':   [(0.0, 1.0, 1.0),  # red decreases
                   (1.0, 0.0, 0.0)],

         'green': [(0.0, 0.0, 0.0),  # green increases
                   (1.0, 1.0, 1.0)],

         'blue':  [(0.0, 0.0, 0.0),  # no blue at all
                   (1.0, 0.0, 0.0)]}

red_green_cm = LinearSegmentedColormap('RedGreen', cdict, N)


# ======
## plot:

colors = cm.get_cmap(red_green_cm, N)

fig = plt.figure()
ax = fig.add_subplot(111)

# each line is of its own color:
for i, x in enumerate(data):
    ax.plot(data, data*x, color=colors(i))

fig.savefig("red-green-cm.png")
结果:
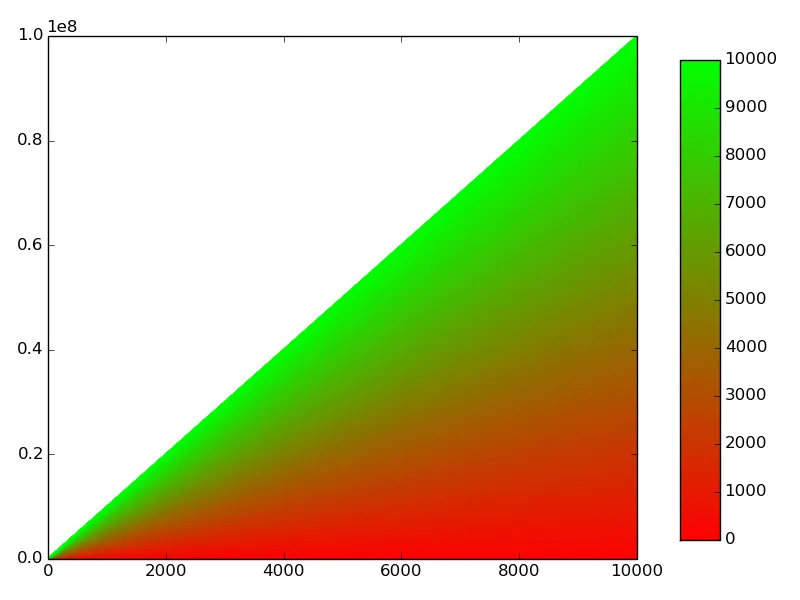
编辑
也可以添加一个色条:
#!/usr/bin/python3

from numpy import arange

import matplotlib as mpl
from matplotlib import pyplot as plt
from matplotlib import cm
from matplotlib.colors import LinearSegmentedColormap


# ======
## data:

N = 10000
data = arange(N +1)


# =================
## custom colormap:

# red-green colormap:
cdict = {'red':   [(0.0, 1.0, 1.0),  # red decreases
                   (1.0, 0.0, 0.0)],

         'green': [(0.0, 0.0, 0.0),  # green increases
                   (1.0, 1.0, 1.0)],

         'blue':  [(0.0, 0.0, 0.0),  # no blue at all
                   (1.0, 0.0, 0.0)] }

red_green_cm = LinearSegmentedColormap('RedGreen', cdict, N)


# ======
## plot:

colors = cm.get_cmap(red_green_cm, N)

fig = plt.figure()
ax = fig.add_subplot(111)

# each line is of its own color:
for i, x in enumerate(data):
    ax.plot(data, data*x, color=colors(i))

# make space for colorbar:
fig.tight_layout(rect=[0, 0, 0.85, 1])

# adding colorbar:
ax_cb = fig.add_axes([0.85, 0.10, 0.05, 0.8])
norm = mpl.colors.Normalize(vmin=data[0], vmax=data[-1])
cb = mpl.colorbar.ColorbarBase(ax_cb, cmap=red_green_cm, norm=norm, orientation='vertical')

fig.savefig("red-green-cm.png")
- Adobe
0
一个在两个极端之间变化的颜色映射被称为Diverging,matplotlib中有一个名为RdYlGn(红-黄-绿)的颜色映射正好符合您的要求。请查看colormaps reference。虽然我不知道范围是否为0到10,000,但它肯定可以处理0到100的范围,您可以将您的范围映射到该范围内。
- Amy Forbes
1
如果数据范围在0到10000之间,建议使用顺序调色板更为合适,尽管不确定数据的性质,很难做出准确判断。 - mwaskom
网页内容由stack overflow 提供, 点击上面的可以查看英文原文,
原文链接
原文链接