摆脱Chart.js画布亚像素

3
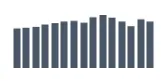
我正在开发一个非常小的小部件,它显示一个简单的条形图:

enter image description here

我正在使用 Chart.js 完成这个特定的任务。
            var canvas = this.$(".chart-canvas")[0];

            if (canvas) {
                var ctx = canvas.getContext("2d");

                ctx.translate(0.5, 0.5);

                window.barChart = new Chart(ctx).Bar(barChartData, {
                    responsive: true,
                    maintainAspectRatio: false,
                    showScale: false,
                    scaleShowGridLines: false,
                    scaleGridLineWidth: 0,
                    barValueSpacing: 1,
                    barDatasetSpacing: 0,
                    showXAxisLabel: false,
                    barShowStroke: false,
                    showTooltips: false,
                    animation: false
                });

如您所见,我已尝试使用

ctx.translate(0.5, 0.5);

但这并没有真正帮助。

有没有办法消除子像素渲染?我已经阅读了有关Bresenham线算法的信息,但不知道如何在其中实现它。

欢迎任何想法/建议。

提前感谢!


请描述“子像素”。 - Justinas
1
@Justinas,这些像素来自于渲染路径的抗锯齿处理。我的目标是生成一张清晰的图表,没有半透明像素。谢谢。 - Kuba
1个回答

3
假设您只有一种颜色,您可以通过扩展图表并覆盖绘制来实现getImageData,"舍入"(如果像素具有R,G或B值,请将其设置为该颜色)像素颜色和putImageData。
对于多个颜色,您也可以这样做,但是当两个颜色靠得很近时会变得有点复杂。
然而,您看到的柱形值间距差异是由Chart.js计算条形x位置的方式造成的 - 这里发生了四舍五入。
您可以扩展图表并覆盖计算x位置的方法以消除四舍五入。
Chart.types.Bar.extend({
    // Passing in a name registers this chart in the Chart namespace in the same way
    name: "BarAlt",
    initialize: function (data) {
        Chart.types.Bar.prototype.initialize.apply(this, arguments);

        // copy paste from library code with only 1 line changed
        this.scale.calculateX = function (index) {
            var isRotated = (this.xLabelRotation > 0),
                innerWidth = this.width - (this.xScalePaddingLeft + this.xScalePaddingRight),
                valueWidth = innerWidth / Math.max((this.valuesCount - ((this.offsetGridLines) ? 0 : 1)), 1),
                valueOffset = (valueWidth * index) + this.xScalePaddingLeft;

            if (this.offsetGridLines) {
                valueOffset += (valueWidth / 2);
            }

            // the library code rounds this off - we don't
            return valueOffset;
        }

        // render again because the original initialize call does a render
        // when animation is off this is the only render that happens
        this.render();
    }
});

您可以这样调用它。
var ctx = document.getElementById('canvas').getContext('2d');
var myBarChart = new Chart(ctx).BarAlt(data, {
     ...

Fiddle - http://jsfiddle.net/gf2c4ue4/

您可以通过放大来更好地看到差异。


上面的图表是扩展图表

enter image description here


我不会依赖颜色 - 可能会有一个有不同背景的条形。不过还是谢谢你的建议! - Kuba

网页内容由stack overflow 提供, 点击上面的
可以查看英文原文,
原文链接