在测试以下递归关系的猜想时
 ,该猜想声称数字序列具有某种周期性。我编写了一个Python程序来计算这些序列并将它们打印成表格。
 1   # Consider the recursive relation x_{i+1} = p-1 - (p*i-1 mod x_i)
 2   # with p prime and x_0 = 1. What is the shortest period of the
 3   # sequence?
 4
 5   from __future__ import print_function
 6   import numpy as np
 7   from matplotlib import pyplot  as plt
 8
 9   # The length of the sequences.
 10  seq_length = 100
 11
 12  upperbound_primes = 30
 13
 14  # Computing a list of prime numbers up to n
 15  def primes(n):
 16   sieve = [True] * n
 17   for i in xrange(3,int(n**0.5)+1,2):
 18     if sieve[i]:
 19         sieve[i*i::2*i]=[False]*((n-i*i-1)/(2*i)+1)
 20   return [2] + [i for i in xrange(3,n,2) if sieve[i]]
 21
 22  # The list of prime numbers up to upperbound_primes
 23  p = primes(upperbound_primes)
 24
 25  # The amount of primes numbers
 26  no_primes = len(p)
 27
 28  # Generate the sequence for the prime number p
 29  def sequence(p):
 30    x = np.empty(seq_length)
 31    x[0] = 1
 32    for i in range(1,seq_length):
 33      x[i] = p - 1 - (p * (i-1) - 1) % x[i-1]
 34    return x
 35
 36  # List with the sequences.
 37  seq = [sequence(i) for i in p]
 38  """
 39  # Print the sequences in a table where the upper row
 40  # indicates the prime numbers.
 41  for i in range(seq_length):
 42    if not i:
 43      for n in p:
 44        print('\t',n,end='')
 45      print('')
 46    print(i+1,'\t',end='')
 47    for j in range(no_primes):
 48      print(seq[j][i],end='\t')
 49    print('\n',end='')
 50  """
 51  def autocor(x):
 52    result = np.correlate(x,x,mode='full')
 53    return result[result.size/2:]
 54
 55
 56  fig = plt.figure('Finding period in the sequences')
 57  k = 0
 58  for s in  seq:
 59    k = k + 1
 60    fig.add_subplot(no_primes,1,k)
 61    plt.title("Prime number %d" % p[k-1])
 62    plt.plot(autocor(s))
 63  plt.show()
 64
现在我想调查我计算出来的这些序列中的周期性。在网上找了一下,似乎有两个选择:
- 对数据进行自相关处理,并寻找第一个峰值。这应该可以给出近似周期。
- 对数据进行FFT。这将显示数字的频率。我不知道这如何提供关于数字序列周期性的任何有用信息。
它给出了以下绘图结果:
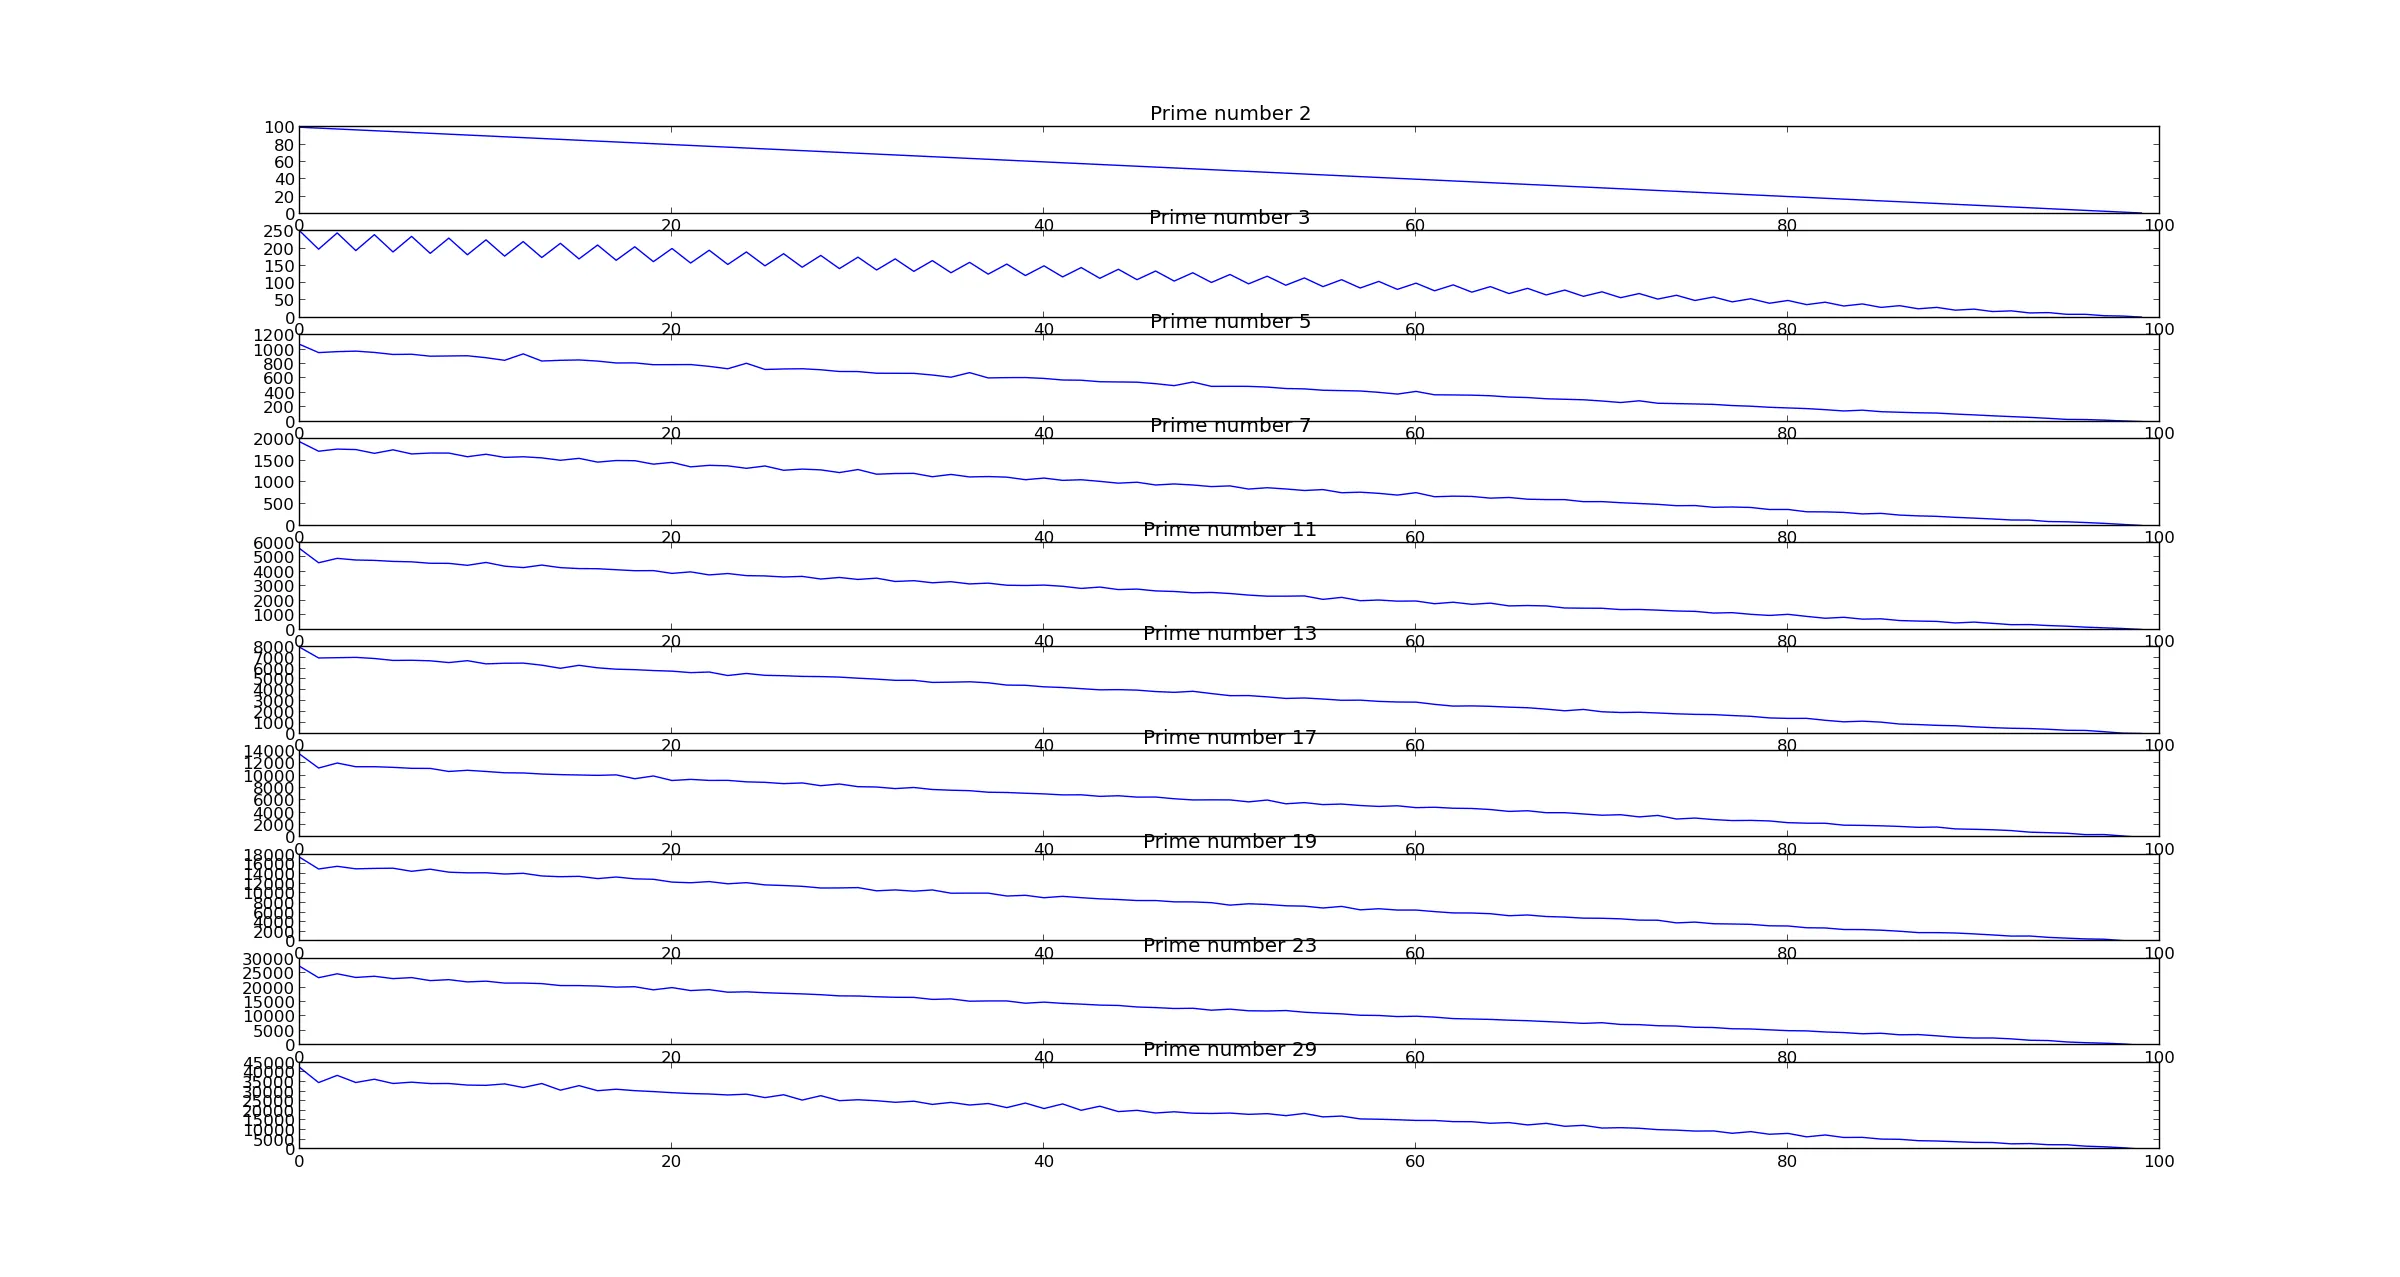 显然,我们看到所有质数的数字都是一个递减的序列。
当在以下简化的Python代码片段上测试相同的方法时:
1 # Testing the autocorrelation of numpy
2
3 import numpy as np
4 from matplotlib import pyplot as plt
5
6 num_samples = 1000
7 t = np.arange(num_samples)
8 dt = 0.1
9
10 def autocor(x):
11 result = np.correlate(x,x,mode='full')
12 return result[result.size/2:]
13
14 def f(x):
15 return [np.sin(i * 2 * np.pi * dt) for i in range(num_samples)]
16
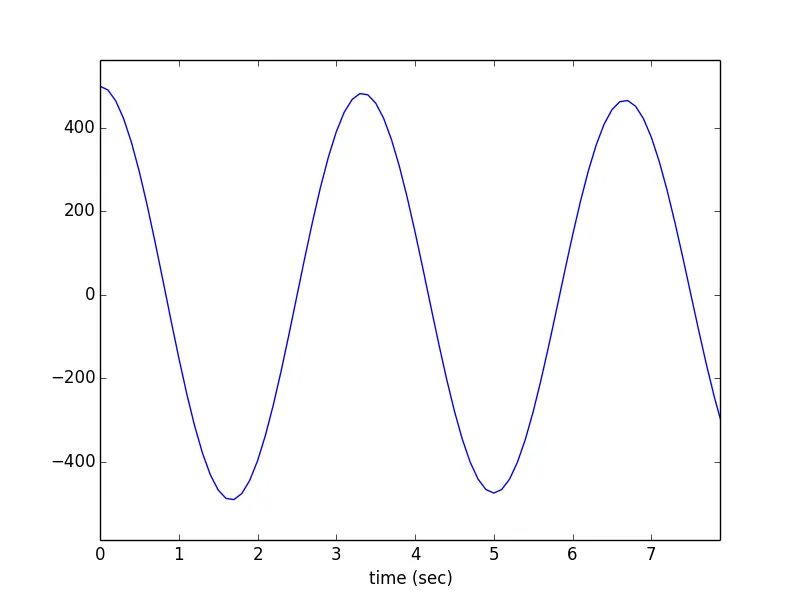
17 plt.plot(autocor(f(t)))
18 plt.show()
我得到了类似的结果,对于正弦函数,它给出以下绘图
如何从正弦函数情况中读取周期性呢?
无论如何,我不理解自相关的机制是如何导致峰值,从而提供信号周期性信息的。有人可以详细说明一下吗?在此背景下如何正确使用自相关性?
此外,在自相关实现中我做错了什么?
欢迎提出确定数列周期性的替代方法建议。
 代码:
代码:
- 关于re bump和mean subtraction:只需看数字。例如,1 2 1 2 1 2将4与5进行比较(如上所述);而0 1 0 1 0 1将0与1进行比较;101、102、101等将20604与20605进行比较。一般来说,自相关依赖于a2 + b2 >= 2ab,这总是正确的,但随着a*b减少,比率会增加。实际上,也许减去最小值更好,但你明白我的意思。2) 关于修剪末尾:np.correlate(a, a[100:-100], mode='valid'),因此每个步骤重叠的点数始终相同。
- tom10