我想给我创建的子图一个简单的标签。不幸的是,我得到了一个丑陋的行为。考虑下面的函数:
function h = set_label1(label)
tlh = get(gca, 'Title');
if strcmp(get(tlh, 'String'), '')
    title(' ');
end
ylh = get(gca, 'YLabel');
if strcmp(get(ylh, 'String'), '')
    ylabel(' ');
end

ylp = get(ylh, 'Position');
x = ylp(1);

tlp = get(tlh, 'Position');
y = tlp(2);

h = text('String', label, ...
        'HorizontalAlignment', 'right',...
        'VerticalAlignment', 'Baseline', ...
        'FontUnits', 'pixels', ...
        'FontSize', 16, ...
        'FontWeight', 'bold', ...
        'FontName', 'Arial', ...
        'Position', [x y 0]);
end
这是一个简单的测试运行:
figure;
h1 = axes('OuterPosition', [0,0,.5 1]);
set(h1,'LooseInset',get(h1,'TightInset'));
h2 = axes('OuterPosition', [.5,0,.5 1]);
set(h2,'LooseInset',get(h2,'TightInset'));

axes(h1);
plot([0 1], [4 5]);
set_label1('A');

axes(h2);
plot([0 1], [4 5]);
set_label1('B');
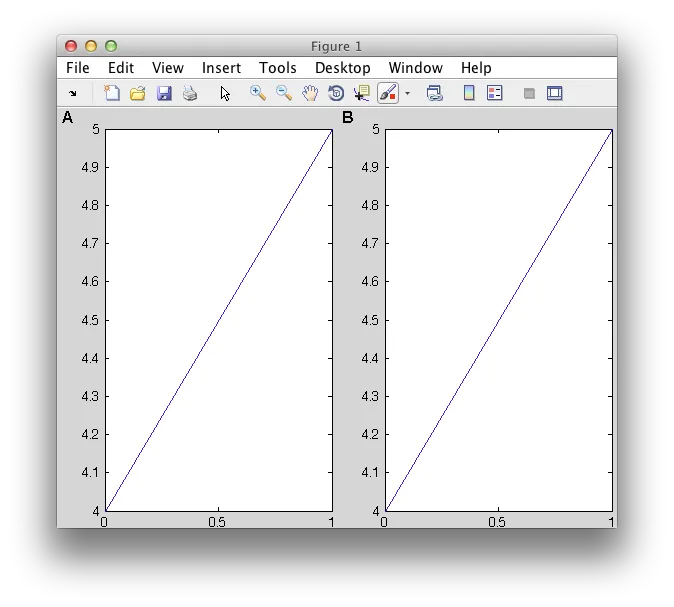
我得到的图片是:
我面临的问题是,我不想指定标签在“数据”单位中的位置。相反,我想使用归一化单位。因此,我使用了函数的修改形式。现在让我们使用这个:
function h = set_label2(label)
tlh = get(gca, 'Title');
if strcmp(get(tlh, 'String'), '')
    title(' ');
end
ylh = get(gca, 'YLabel');
if strcmp(get(ylh, 'String'), '')
    ylabel(' ');
end

oldUnits = replace_prop(ylh, 'Units', 'normalized');
ylp = get(ylh, 'Position');
x = ylp(1);
set(ylh, 'Units', oldUnits);

oldUnits = replace_prop(tlh, 'Units', 'normalized');
tlp = get(tlh, 'Position');
y = tlp(2);
set(ylh, 'Units', oldUnits);

h = text('String', label, ...
        'HorizontalAlignment', 'right',...
        'VerticalAlignment', 'Baseline', ...
        'FontUnits', 'pixels', ...
        'FontSize', 16, ...
        'FontWeight', 'bold', ...
        'FontName', 'Arial', ...
        'Units', 'normalized',...
        'Position', [x y 0]);
end

function oldvalue = replace_prop(handle, propName, newvalue)
oldvalue = get(handle, propName);
set(handle, propName, newvalue);
end
运行相同的测试:
figure;
h1 = axes('OuterPosition', [0,0,.5 1]);
set(h1,'LooseInset',get(h1,'TightInset'));
h2 = axes('OuterPosition', [.5,0,.5 1]);
set(h2,'LooseInset',get(h2,'TightInset'));

axes(h1);
plot([0 1], [4 5]);
set_label2('A');

axes(h2);
plot([0 1], [4 5]);
set_label2('B');
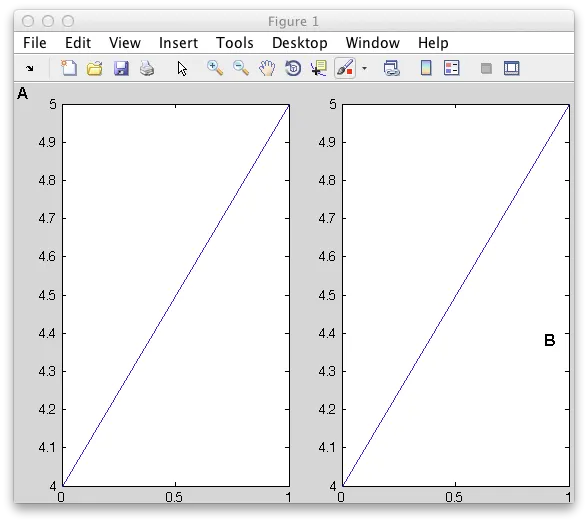
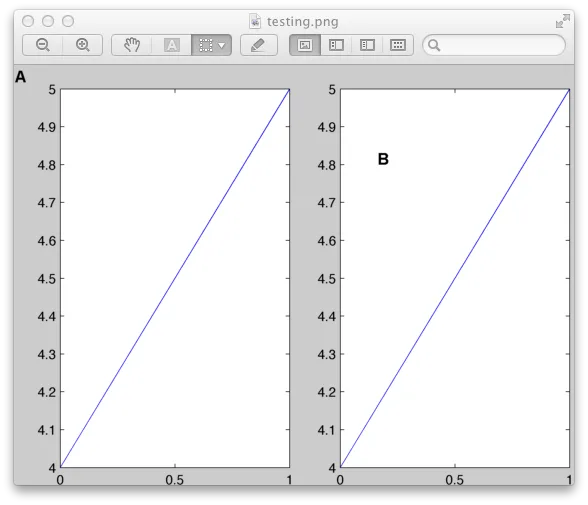
我们得到了与之前完全相同的图像。唯一的问题是现在调整大小时会出现一些问题:
标签实际上处于正确的位置。但似乎我使用的“LooseInset”和“TightInset”属性会使轴表现得好像没有标签一样。 有没有解决办法?实际上我所做的只是获取标题和纵轴标签在归一化单位中的位置,而不是在数据单位中,这似乎会导致问题。
我需要以归一化单位获取它的原因是为了当我们得到一个3D绘图时,我可以根据标题和zlabel来定位标签的位置。
 我喜欢这个函数的原因是,如果我存储了从中返回的单元格,然后再放回去,我可以改变位置。例如,如果
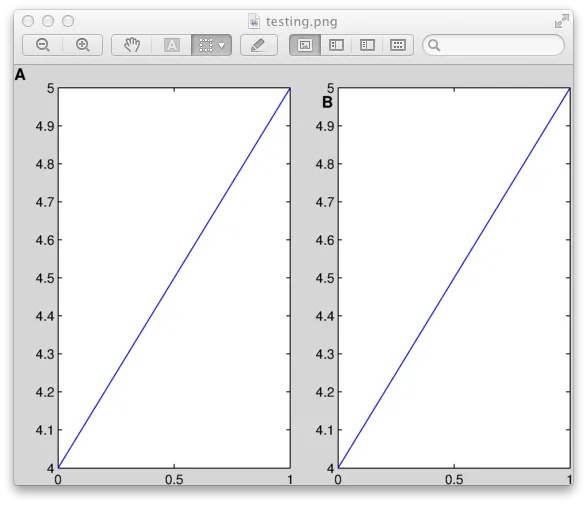
LooseInset是一个未记录的属性。 - Amro