我正在使用Matlab将来自9个不同来源的数据绘制到子图中。下面是我的图像:
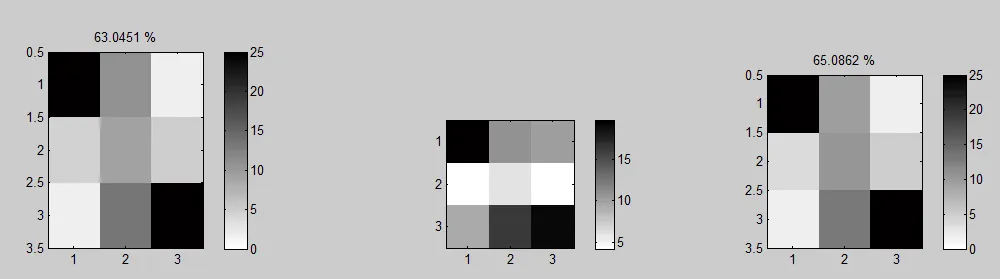
每行代表不同条件下某一变量的结果。因此第1行是变量1,第2行是变量2等等。不管怎样,从图片可以看出,与第二行中的另外两个子图相比,中心子图的比例似乎有些奇怪。
我使用的代码包括以下命令:
请注意,每行图中的绘图数据具有相等大小的矩阵。第1行:7x7矩阵,在第2行:3x3矩阵,在第3行:4x4矩阵。
我该如何解决这个问题? :)
感谢任何帮助!
更新:
在尝试使用以下命令后发生了什么:
这里是一个最小化的工作示例:(它显然不能完全给出相同的结果,但仍存在类似的问题):
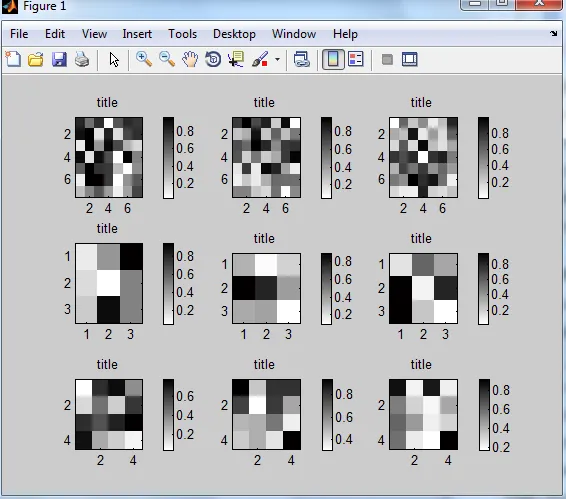
您应该会得到类似这样的东西:
每行代表不同条件下某一变量的结果。因此第1行是变量1,第2行是变量2等等。不管怎样,从图片可以看出,与第二行中的另外两个子图相比,中心子图的比例似乎有些奇怪。
我使用的代码包括以下命令:
subplot(3,3,i), imagesc(data), colorbar, colormap(flipud(gray)), title('sometitle'), caxis([limits])
我尝试通过使用ylim([0.5 3.5])设置y限制来修复中心子图,但是这没有效果...当我尝试ylim([0 4])时,会出现以下情况:请注意,每行图中的绘图数据具有相等大小的矩阵。第1行:7x7矩阵,在第2行:3x3矩阵,在第3行:4x4矩阵。
我该如何解决这个问题? :)
感谢任何帮助!
更新:
在尝试使用以下命令后发生了什么:
subplot(3,3,5)
imagesc(data)
axis square
colorbar
这里是一个最小化的工作示例:(它显然不能完全给出相同的结果,但仍存在类似的问题):
data11 = rand(7,7);
data12 = rand(7,7);
data13 = rand(7,7);
data21 = rand(3,3);
data22 = rand(3,3);
data23 = rand(3,3);
data31 = rand(4,4);
data32 = rand(4,4);
data33 = rand(4,4);
subplot(3,3,1)
imagesc(data11)
colorbar
colormap(flipud(gray))
title('title')
subplot(3,3,2)
imagesc(data12)
colorbar
colormap(flipud(gray))
title('title')
subplot(3,3,3)
imagesc(data13)
colorbar
colormap(flipud(gray))
title('title')
subplot(3,3,4)
imagesc(data21)
colorbar
title('title')
subplot(3,3,5)
imagesc(data22)
colorbar
title('title')
subplot(3,3,6)
imagesc(data23)
colorbar
title('title')
subplot(3,3,7)
imagesc(data31)
colorbar
title('title')
subplot(3,3,8)
imagesc(data32)
colorbar
title('title')
subplot(3,3,9)
imagesc(data33)
colorbar
title('title')
您应该会得到类似这样的东西:
imagesc之后添加axis square,看看是否解决了问题。 - bla