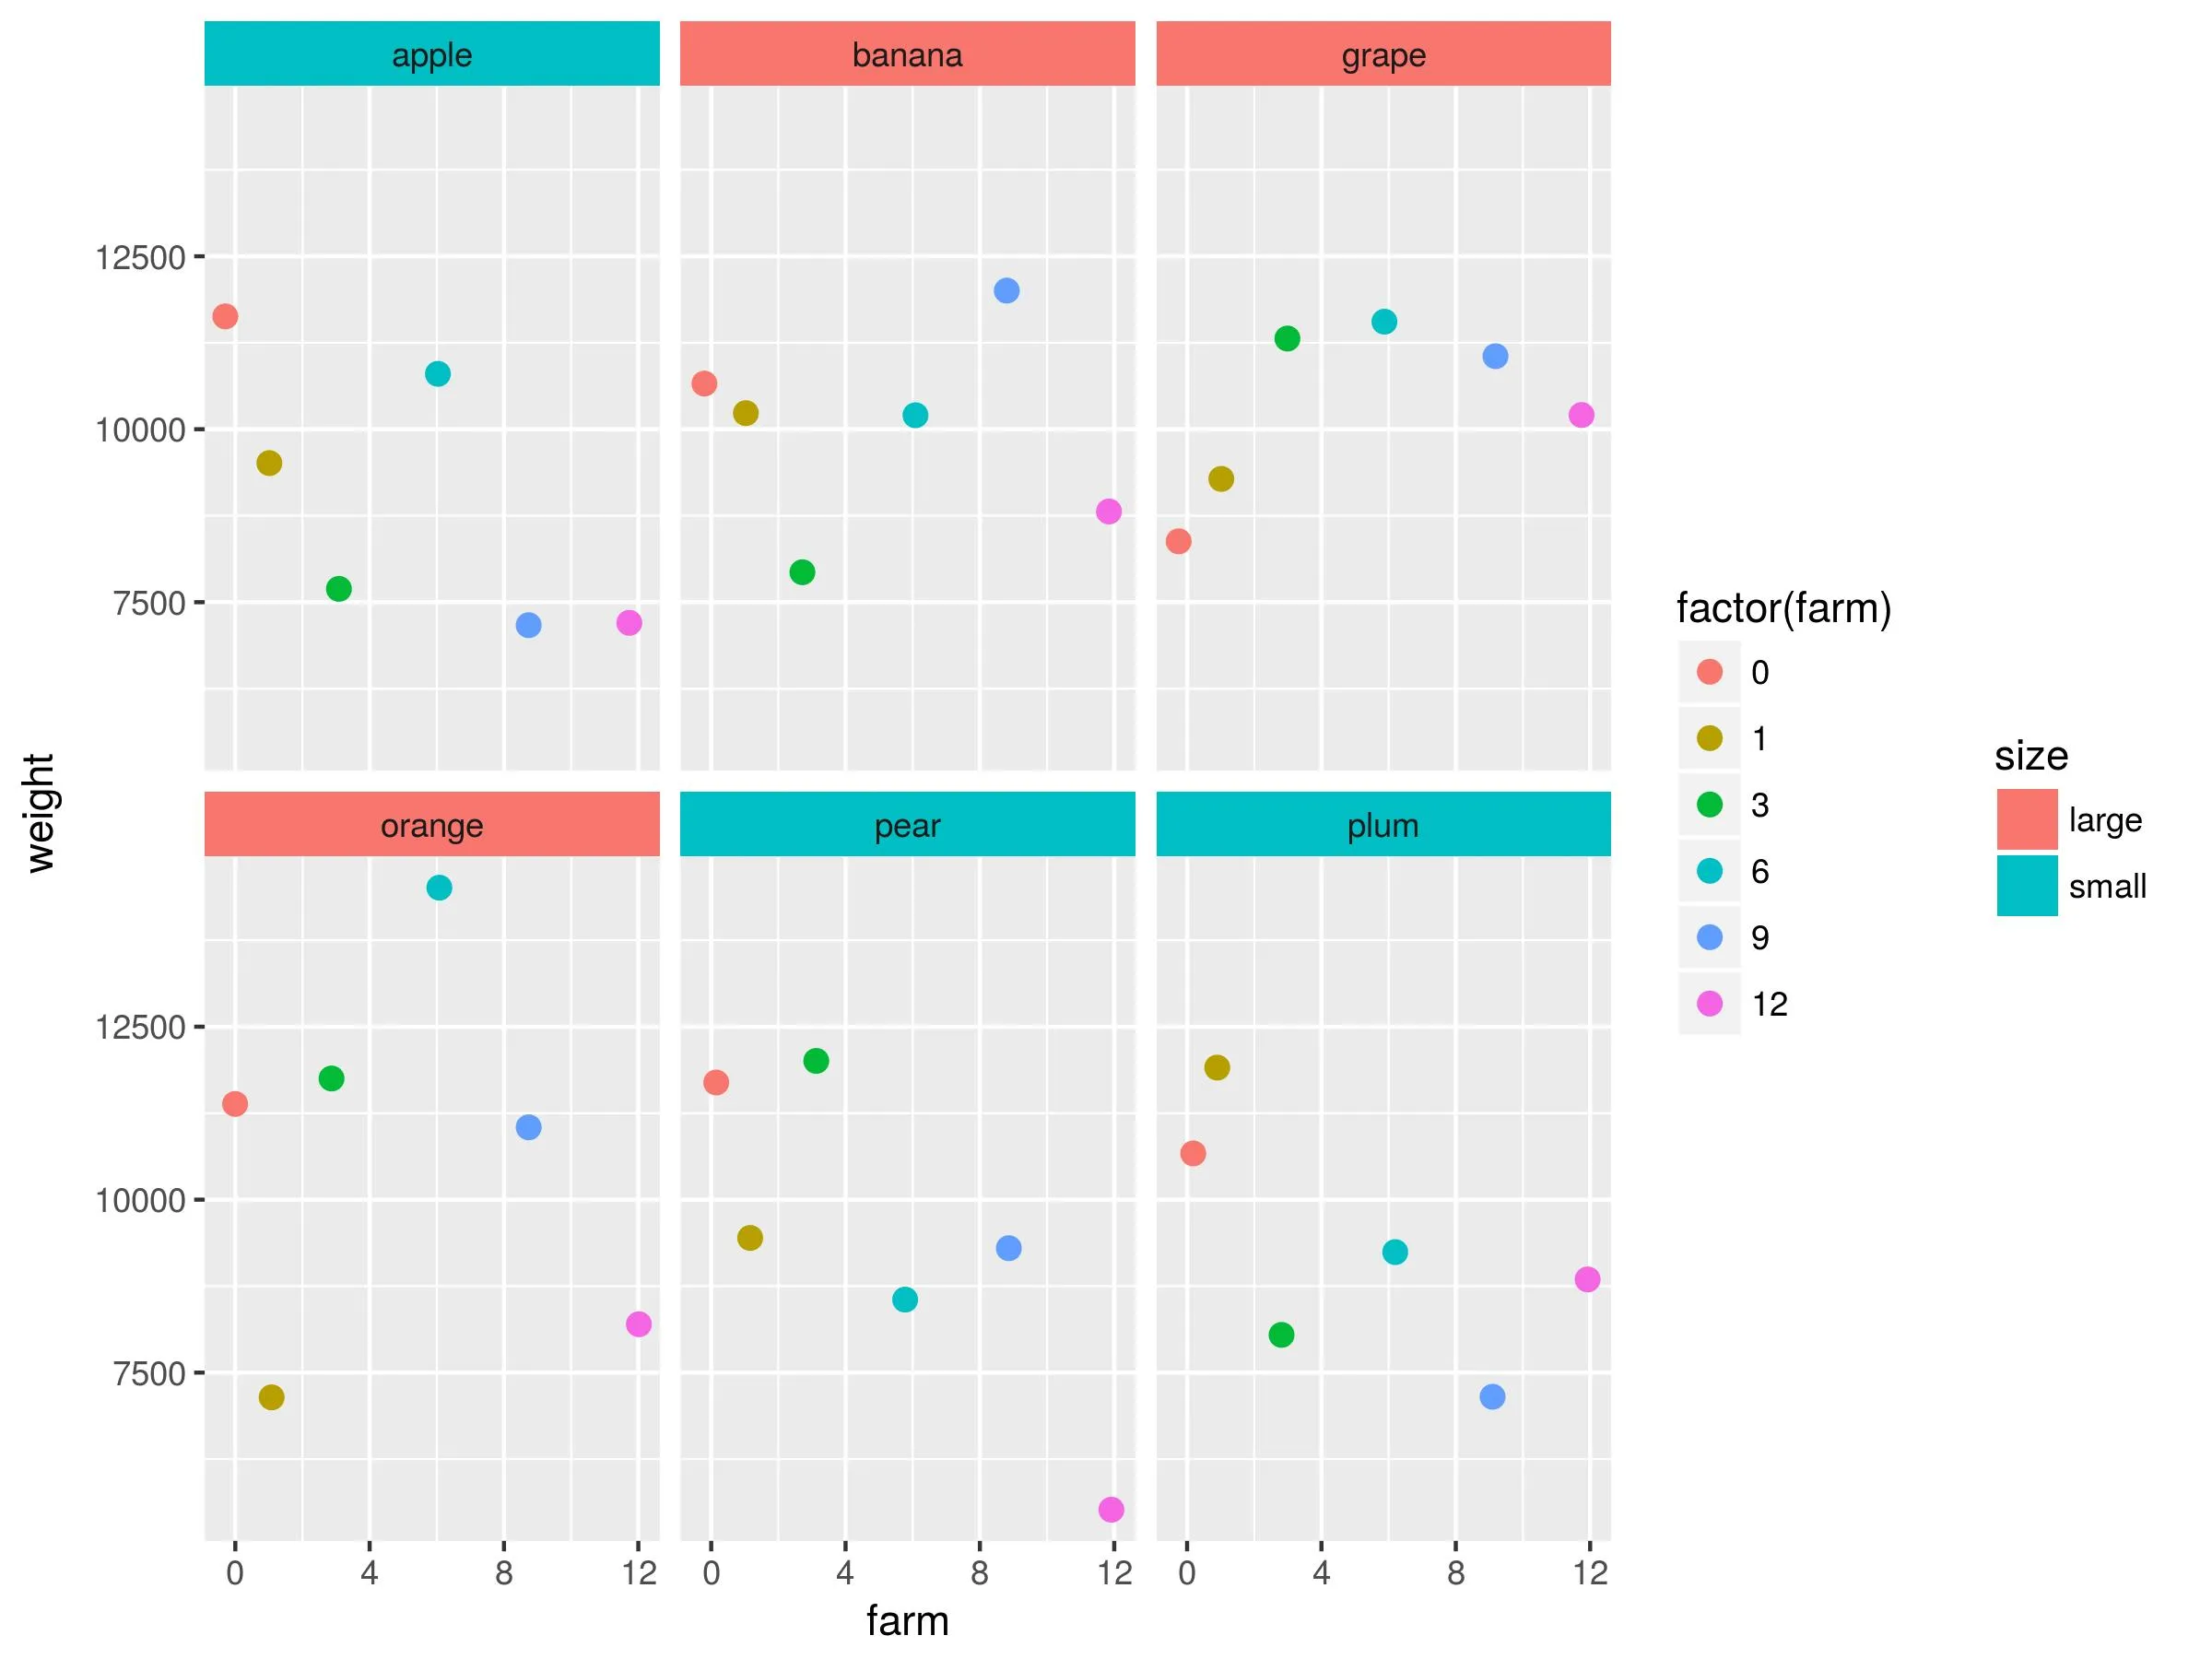
我使用了在这里提出的解决方法,根据数据框中提供的变量为
facet_wrap创建的分面的条纹着色。
我需要为条纹颜色(size)添加图例,该图例绘制在dummy中。
有什么办法可以从g2$layout中获取它,或者其他方法吗?library(gtable)
library(grid)
d <- data.frame(fruit = rep(c("apple", "orange", "plum", "banana", "pear", "grape")),
farm = rep(c(0,1,3,6,9,12), each=6),
weight = rnorm(36, 10000, 2500),
size=rep(c("small", "large")))
p1 = ggplot(data = d, aes(x = farm, y = weight)) +
geom_jitter(position = position_jitter(width = 0.3),
aes(color = factor(farm)), size = 2.5, alpha = 1) +
facet_wrap(~fruit)
dummy <- ggplot(data = d, aes(x = farm, y = weight))+ facet_wrap(~fruit) +
geom_rect(aes(fill=size), xmin=-Inf, xmax=Inf, ymin=-Inf, ymax=Inf) +
theme_minimal()
g1 <- ggplotGrob(p1)
g2 <- ggplotGrob(dummy)
gtable_select <- function (x, ...)
{
matches <- c(...)
x$layout <- x$layout[matches, , drop = FALSE]
x$grobs <- x$grobs[matches]
x
}
panels <- grepl(pattern="panel", g2$layout$name)
strips <- grepl(pattern="strip-t", g2$layout$name)
g2$layout$t[panels] <- g2$layout$t[panels] - 1
g2$layout$b[panels] <- g2$layout$b[panels] - 1
new_strips <- gtable_select(g2, panels | strips)
grid.newpage()
grid.draw(new_strips)
gtable_stack <- function(g1, g2){
g1$grobs <- c(g1$grobs, g2$grobs)
g1$layout <- transform(g1$layout, z= z-max(z), name="g2")
g1$layout <- rbind(g1$layout, g2$layout)
g1
}
new_plot <- gtable_stack(g1, new_strips)
grid.newpage()
grid.draw(new_plot)
grid.arrange更改为ggdraw() + draw_plot(new_plot, 0, 0, 1, 1) + draw_plot(facet.legend, 0.63, 0.05, .3, .3),以便将facet.legend放在new_plot的顶部,利用图形的无法使用的空间,以节省空间。使用了library(cowplot)。 - Jei