1个回答
8
import osmnx as ox
import networkx as nx
让我们来看这个区域
coords, dist = (51.5178, 9.9601), 9000
G = ox.graph.graph_from_point( coords, dist=dist, network_type='drive', simplify=True)
G = ox.add_edge_speeds(G)
G = ox.add_edge_travel_times(G)
使用nx.all_pairs_dijkstra_path_length作为基准。
为此,让我们创建缩写bench_nx:
bench_nx = lambda G, weight='travel_time': sum((l:=[ d for t in nx.all_pairs_dijkstra_path_length(G, weight=weight) for d in t[1].values() ])) / len(l)
bench_nx(G)
582.2692172953298
%timeit -n 3 -r 2 bench_nx(G)
53.7 s ± 101 ms per loop (mean ± std. dev. of 2 runs, 3 loops each)
并行化
def mp_all_pairs_dijkstra_path_length(G, cutoff=None, weight='weight'):
    """
    Multi-core version of
    nx.all_pairs_dijkstra_path_length
    """

    import multiprocessing as mp
    from functools import partial

    f = partial(nx.single_source_dijkstra_path_length,
                G, cutoff=cutoff, weight=weight)

    with mp.Pool(mp.cpu_count()) as p:

        lengths = p.map(f, G)
        for n, l in zip(G, lengths):
            yield n, l
bench_mp = lambda G, weight='travel_time': sum((l:=[ d for t in mp_all_pairs_dijkstra_path_length(G, weight=weight) for d in t[1].values() ])) / len(l)
bench_mp(G)
582.2692172953298
%timeit -n 3 -r 2 bench_mp(G)
20.2 s ± 754 ms per loop (mean ± std. dev. of 2 runs, 3 loops each)
图形越大,这里的优势似乎就越大。
graph-tools
使用graph-tool可以更快地加速。
graph-tool使用整数对顶点和边进行索引。因此,我在这里创建了两个字典:
nx_node->gt_idxu,v,k(edge ) ->gt_idx
以便能够从nx映射到gt。
import graph_tool.all as gt
from collections import defaultdict

G_gt = gt.Graph(directed=G.is_directed())

# "Dict" [idx] = weight
G_gt_weights = G_gt.new_edge_property("double")

# mapping of nx vertices to gt indices
vertices = {}
for node in G.nodes:

    v = G_gt.add_vertex()
    vertices[node] = v

# mapping of nx edges to gt edge indices
edges = defaultdict(lambda: defaultdict(dict))

for src, dst, k, data in G.edges(data=True, keys=True):

    # Look up the vertex idxs from our vertices mapping and add edge.
    e = G_gt.add_edge(vertices[src], vertices[dst])
    edges[src][dst][k] = e

    # Save weights in property map
    G_gt_weights[e] = data['travel_time']
注意:我添加了截断值
1e50,因为gt将不可到达的目的地设置为距离1.79e308。bench_gt = lambda G, weights: sum((l:=[ d for l in gt.shortest_distance(G, weights=weights) for d in l if 0 < d <= 1e50 ])) / len(l)
bench_gt(G_gt, G_gt_weights)
582.4092142257183
%timeit -n 3 -r 2 bench_gt(G_gt, G_gt_weights)
4.76 s ± 27.4 ms per loop (mean ± std. dev. of 2 runs, 3 loops each)
这至少是一个11倍的改进。
子采样
原来distance_histogram()可以进行子采样,并且在编译时启用并行运行!
def subsample_APSP(G, weights=G_weight):
    """Estimate mean and error"""

    def sample_mean(samples, G=G, weights=weights):
        """Calculate mean from histogram of samples samples"""
        counts, bins = gt.distance_histogram(G, weight=weights, samples=samples)
        return sum(counts * (.5 + bins[:-1])) / sum(counts)

    N_samples = int( round( G.num_vertices() / 2, 0) )
    N = int( round( math.sqrt(N_samples), 0 ) )
    M = int( round( N_samples / N, 0 ) )

    out = [ sample_mean(M) for _ in range(N) ]

    return sum(out) / len(out), np.std(out) / math.sqrt(N)
print("{:.2f} +- {:.2f}".format(*subsample_APSP(G)))
582.55 +- 2.83
注意:由于第一个箱存在差异,存在一定偏差。
%timeit subsample_APSP(G)
222 ms ± 58.3 ms per loop (mean ± std. dev. of 7 runs, 1 loop each)
这是另一个因素50和总加速241的速度提升!
附录
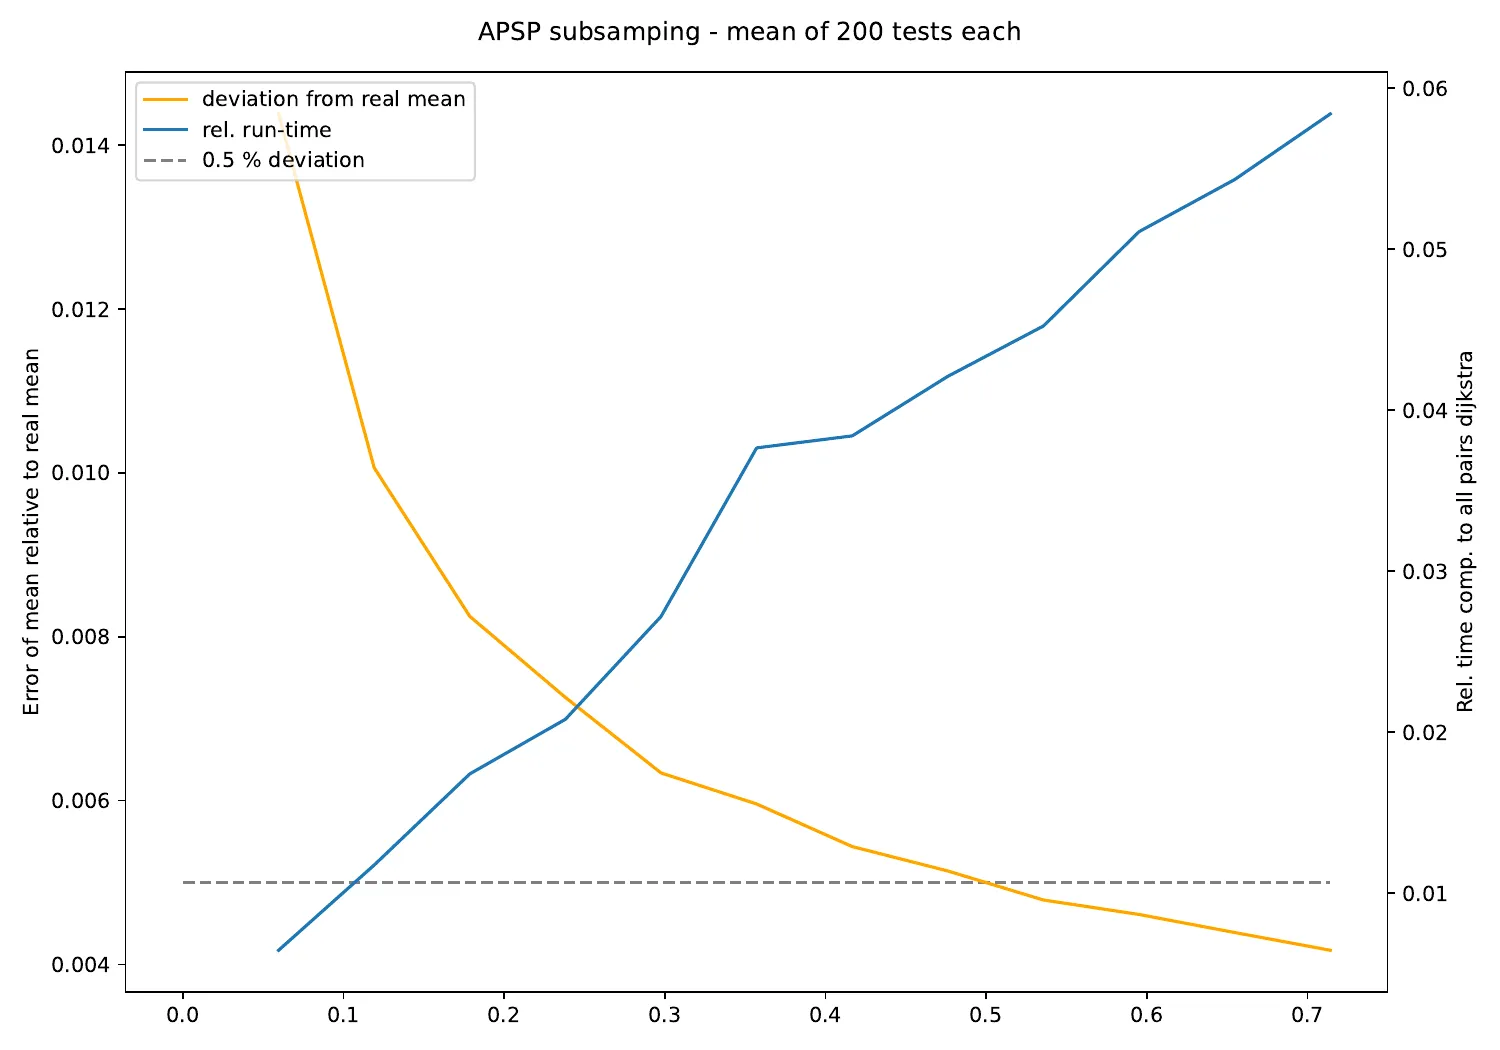 X轴是所涉及的顶点总数相对于总顶点数的分数。
- Suuuehgi
网页内容由stack overflow 提供, 点击上面的可以查看英文原文,
原文链接
原文链接