Flot标签与我的折线图重叠

6

我正在使用flot的线图功能,但是我遇到了一些麻烦:我的x和y轴标签会重叠在图形上。我的图表看起来像这样:

enter image description here

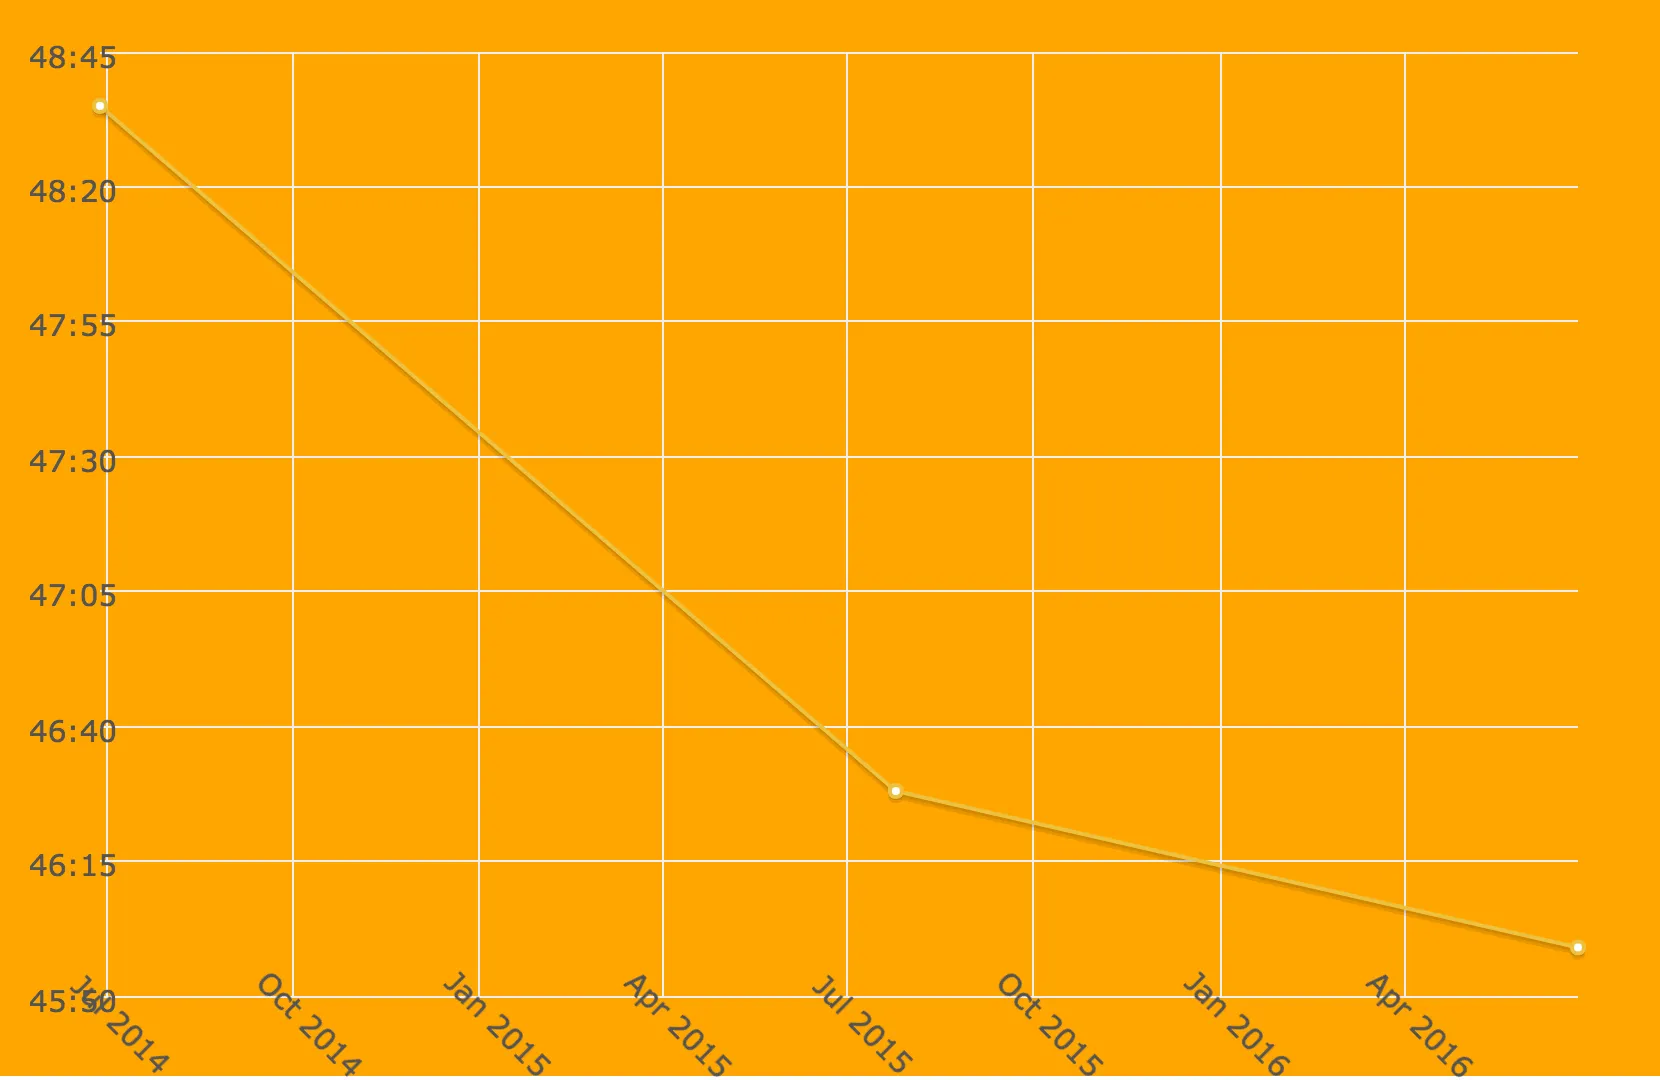
理想情况下,我希望将标签移到左侧和底部,以免与图形重叠。我构建图表的方式如下:

$(function() {

<%
  js_data = []
  ids = []
  @user_my_objects.each do |user_my_object|
    ids.push( user_my_object.id )
    my_object_day_time_in_ms = user_my_object.my_object.day.strftime('%Q')
    js_data.push( "[#{my_object_day_time_in_ms}, #{user_my_object.time_in_ms}]" )
  end
%>
        // <%= ids %>
        var data = [<%=h js_data.join(",") %>];

        $("<div id='tooltip'></div>").css({
                position: "absolute",
                display: "none",
                border: "1px solid #fdd",
                padding: "2px",
                "background-color": "#fee",
                opacity: 0.80
        }).appendTo("body");

        $.plot("#placeholder", [data], {
                yaxis: {
                        tickFormatter: formatTime
                },
                xaxis: { mode: "time" },
                points: {
                        show: true
                },
                lines: {
                        show: true
                },
                grid: {
                      hoverable: true,
                      clickable: true,
                      tickColor: "#efefef",
                      borderWidth: 0,
                      borderColor: "#efefef"
                },
                tooltip: true
        });

        $("#placeholder").bind("plothover", function (event, pos, item) {
                if (item) {
                        var x = item.datapoint[0].toFixed(2),
                                y = item.datapoint[1].toFixed(2);

                        console.log("x:" + x)
                        dateObj = new Date(parseInt(x))
                        var dateStr = $.datepicker.formatDate('MM dd, yy', dateObj)
                        $("#tooltip").html( dateStr + " - " + formatTime(y) )
                                .css({top: item.pageY+5, left: item.pageX+5})
                                .fadeIn(200);
                } else {
                        $("#tooltip").hide();
                }
        });

});

编辑:遗憾的是,这个难以捉摸的代码示例地址为 http://jsfiddle.net/edc8jd31/1/


1
尝试在 grid 下使用 marginlabelMargin 选项,参见此处 - Raidri
那么“labelMargin”,对吧,因为“margin”似乎只是将所有东西移动到div的边缘之外?另外,我是否可以使x轴标签与y轴标签的距离不同? - Dave
使用 labelWidth 和/或 labelHeight 选项来设置 x 轴的标签宽度和高度。 - Raidri
嗯,似乎什么也没发生。那y轴呢? - Dave
3
你能否创建一个 fiddle,以展示你现在的图表? - Raidri
显示剩余2条评论
4个回答

3
请将以下内容添加到您的 CSS 中:
#placeholder div.xAxis div.tickLabel {
    transform: rotate(0deg) !important;
    margin-top:10px;
}

#placeholder div.yAxis div.tickLabel {
    margin-right: 10px !important;
}

输出:

修改CSS后的效果


如果Dave不想要旋转标签,为什么他一开始就加了transform: rotate()呢?只需删除样式比添加另一个transform: rotate(0)更好... - Raidri
嗨@Raidri,我不确定那个。而且,我不认为那是他添加的自定义样式。我发布它时假设它是插件的标准CSS,他正在使用它。由于他无法将它们作为外部文件加载,他可能只是将其粘贴在那里。抱歉我误解了。 - SE_User

2
从您的小提琴开始,在CSS中的transform行中添加translateY(15px),并将labelHeight:30添加到xaxis选项中。请参阅更新的小提琴以获取完整示例。

enter image description here

解释: 通过在轴标签上使用transform: rotate(45%),您可以将它们围绕其中心旋转,从而使左半部分位于轴上方。附加的平移将标签移动到轴下方。labelHeight选项是必需的,以使标签的右半部分不会超出图表边缘。

1

我不确定我是否正确理解了您的问题,但您只是想移动x和z轴的标签而不移动图形本身,对吗?

也许对于x轴,CSS3属性transform: translate(x, y);对您很有用。

而对于y轴,理论上可以做同样的事情,但向下移动最好使用margin。

要旋转标签,请使用transform: rotate(degrees)

所以这可能有效:

#placeholder div.yAxis div.tickLabel
{
  transform: translate(-10px, 0px);
}

#placeholder div.xAxis div.tickLabel
{
  margin-top: 20px;
  transform: rotate(45deg);
}

我尝试了你的建议 - http://jsfiddle.net/edc8jd31/4/,但是x轴标签不再像之前那样倾斜。我希望它们仍然倾斜,但不要覆盖图表或y轴标签。 - Dave
然后使用 transform: rotate 来实现这个效果。我已经更新了答案。 - Morris Janatzek

1
我不是很确定是否理解了你的问题,但你是否希望得到类似这样的效果?
使用简单的jQuery来改变每个X轴div的CSS。

jQuery代码:
$('.xAxis.x1Axis div.tickLabel').each(function() {

   var newVal = $(this).css('left');
   newVal = parseInt(newVal.substring(0, newVal.indexOf("px"))) + 15;
   $(this).css('left', newVal);

   //$(this).css('top', "492px");
   // Instead of above commented line You can use css directly.

});

CSS:
.xAxis.x1Axis .tickLabel
{
  top :492px !important;
}

function formatTime(duration) {
  var milliseconds = parseInt((duration % 1000) / 100),
    seconds = parseInt((duration / 1000) % 60),
    minutes = parseInt((duration / (1000 * 60)) % 60),
    hours = parseInt((duration / (1000 * 60 * 60)) % 24);

  hours = (hours < 10) ? "0" + hours : hours;
  minutes = (minutes < 10) ? "0" + minutes : minutes;
  seconds = (seconds < 10) ? "0" + seconds : seconds;

  return (hours > 0 ? hours + ":" : "") + minutes + ":" + seconds + (milliseconds > 0 ? "." + milliseconds : "");
}

$(function() {

  // [4775444, 4775496, 4775541]
  var data = [
    [1403913600000, 2915000],
    [1437782400000, 2788000],
    [1466812800000, 2759000]
  ];

  $("<div id='tooltip'></div>").css({
    position: "absolute",
    display: "none",
    border: "1px solid #fdd",
    padding: "2px",
    "background-color": "#fee",
    opacity: 0.80
  }).appendTo("body");

  $.plot("#placeholder", [data], {
    yaxis: {
      tickFormatter: formatTime
    },
    xaxis: {
      mode: "time"
    },
    points: {
      show: true
    },
    lines: {
      show: true
    },
    grid: {
      margin: 10,
      labelMargin: 5,
      labelWidth: 20,
      hoverable: true,
      clickable: true,
      tickColor: "#efefef",
      borderWidth: 0,
      borderColor: "#efefef"
    },
    tooltip: true
  });

  $("#placeholder").bind("plothover", function(event, pos, item) {
    if (item) {
      var x = item.datapoint[0].toFixed(2),
        y = item.datapoint[1].toFixed(2);

      console.log("x:" + x)
      dateObj = new Date(parseInt(x))
      var dateStr = $.datepicker.formatDate('MM dd, yy', dateObj)
      $("#tooltip").html(dateStr + " - " + formatTime(y))
        .css({
          top: item.pageY + 5,
          left: item.pageX + 5
        })
        .fadeIn(200);
    } else {
      $("#tooltip").hide();
    }
  });

  $('.xAxis.x1Axis div.tickLabel').each(function() {

    var newVal = $(this).css('left');
    newVal = parseInt(newVal.substring(0, newVal.indexOf("px"))) + 15;
    $(this).css('left', newVal);

    //$(this).css('top', "492px");
    // instead of hardcoding you can apply via css:

  });

});
.demo-container {
  padding: 20px;
  background-color: orange;
}
#placeholder div.xAxis div.tickLabel {
  transform: rotate(45deg);
  -ms-transform: rotate(45deg);
  /* IE 9 */
  -moz-transform: rotate(45deg);
  /* Firefox */
  -webkit-transform: rotate(45deg);
  /* Safari and Chrome */
  -o-transform: rotate(-90deg);
  /* Opera */
  /*rotation-point:50% 50%;*/
  /* CSS3 */
  /*rotation:270deg;*/
  /* CSS3 */
}

.xAxis.x1Axis .tickLabel
{
  top :492px !important;
}
<script src="https://ajax.googleapis.com/ajax/libs/jquery/2.1.1/jquery.min.js"></script>
<script src="http://people.iola.dk/olau/flot/jquery.flot.js"></script>

<div class="demo-container">
  <div id="placeholder" class="demo-placeholder" style="width:800px; height:500px;"></div>
</div>


这就是我想要的——移动那些标签,使它们不会互相覆盖。但是我注意到为了让它工作,你使用了"$(this).css('top', "492px")"。有没有办法在不硬编码像素值的情况下实现这一点,或者可能将其相对于某些东西进行调整?我不知道图表是否总是这些尺寸。 - Dave
@Dave 是的,你也可以通过 CSS 进行应用,我刚刚更新了我的代码。祝你编码愉快 :) - Arun CM

网页内容由stack overflow 提供, 点击上面的
可以查看英文原文,
原文链接